Signals
What Is Log Aggregation (and Where It Breaks at Scale)


Here’s the short version. Log aggregation is what happens when you get sick of SSHing into forty machines to find one line of text. You pull every log into one place. You search it in one query instead of forty. Simple.
Here’s the long version, which is the one that actually matters, because “simple” is exactly what log aggregation stops being once real traffic shows up.
Centralized logging is one of those ideas everyone agrees with immediately, usually before anyone asks who will pay to store all of it.
This is that version. Told the way it actually happens: in stages, by volume, getting worse before Grepr gets involved. Bring your own coffee.
At this stage, log aggregation is boring. Good boring.
Definition, since you’ll want it for the meeting: Log aggregation is the process of collecting log data from distributed sources—servers, containers, load balancers, applications and network devices—and consolidating it in one centralized place.
The logs can then be searched, correlated and analyzed as a single dataset instead of a hundred disconnected files.
That’s the whole mechanical idea. An agent tails a file. A forwarder ships it somewhere. A parser turns raw text into fields people can query. You now have a search bar instead of a filing cabinet.
Log aggregation vs log management
People mix these up constantly, even though they solve different parts of the problem.
You can nail aggregation and still have a log management mess because nobody decided what should happen to the data once it lands. Most teams find this out the expensive way.
Why bother aggregating logs at all? The same reasons every team eventually does:
Log aggregation earns its keep early. That isn’t the part that goes wrong.
At under 1GB a day, none of this matters yet. Enjoy it.
The pipeline is real now. Collection, transport, parsing and indexing are running the way they are supposed to.
At this point, many teams move from batch processing to a streaming pipeline. Engines such as Apache Flink can process, enrich and route events within seconds, allowing alerts to respond to current conditions instead of waiting for a nightly job to report that something broke six hours ago.
Everyone is happy at 10GB. Dashboards look great. This is log aggregation working exactly as advertised—and it is the part of the story immediately before the part where it is not fine.
Somewhere around here, log aggregation stops being only an engineering decision and starts becoming a finance conversation.
Once logs enter a premium observability platform, they can begin accumulating ingest, indexing, retention and query costs, depending on the vendor’s pricing model. Those costs apply whether a human studies every event or most of the data quietly waits for a query that never comes.
Across customer environments, Grepr has found that a large share of log traffic can consist of recurring patterns: health checks, retries, routine status messages and debug lines emitted thousands of times by systems that are technically working.
Traditional aggregation does not know which repetition is useful. It centralizes both signal and static, then forwards the invoice.
High cardinality adds another cost and performance pressure. Request IDs, pod names, user IDs and trace IDs are valuable because they help engineers follow individual events. They also create enormous numbers of unique field values.
Depending on the platform’s architecture and pricing model, this can increase index size, memory requirements and query work even when traffic has not grown at the same rate.
Cardinality is not the only reason an observability bill rises, but it is one of the easiest multipliers to miss when teams look only at raw event count.
Volume this size places pressure on two parts of log aggregation at once.
First, the pipeline starts to strain.
A tier sized for normal traffic may hold up on an ordinary Tuesday and struggle during a deploy storm, retry cascade or actual incident—which is, infuriatingly, exactly when the logs matter most.
Vertical scaling can buy time, but it rarely removes the underlying burst, routing and backpressure problems. File-based collection can add more delay because logs must reach disk before they are forwarded.
Second, alert fatigue sets in.
Unfiltered log volume can become unfiltered alert volume. Once noise and cardinality go unmanaged, on-call engineers get paged repeatedly for low-value events until the one page that matters is buried beneath forty that did not.
This is the moment engineers stop trusting their own alerting. The system is not exactly lying to them. It is shouting too loudly to be understood.
Somewhere in here, someone in a meeting says, “Let’s just log less.”
Everyone knows this is a bad idea. Everyone considers it anyway.
“Log less” is attractive advice in the same way “have fewer problems” is attractive advice. It is technically correct and operationally useless.
This is where log aggregation at scale stops resembling the tidy definition from the top of the article.
Retention becomes a fight no single policy can win. Security logs may need to remain available for a year. Debug logs may lose most of their operational value after a week. Business-relevant logs might be useful for ninety days because someone intends to build an analytics project around them.
Every team believes it has a retention policy. Quite often, it has three opinions, two compliance requirements and a storage bill making the final decision.
When a pipeline lacks meaningful retention tiers, teams face a bad choice: pay premium rates to retain everything or delete data that may later matter during an audit or incident.
Microservices add another problem.
In a monolith, one log file could tell most of the story. In a system with dozens or hundreds of services, a single request scatters events across containers, queues and orchestration layers.
Without consistent correlation or trace IDs, aggregation centralizes the fragmentation instead of solving it. All the logs are now in one place, and the team still cannot follow the request.
Migration also becomes harder with time. Dashboards, saved searches, integrations and alert rules accumulate inside the destination platform like sediment.
What started as a configuration change six months ago becomes a multi-quarter project with a name and a Slack channel.
This is where it breaks. Not dramatically. Gradually, then all at once, the way cost problems usually do.
A log aggregator is the technology responsible for collecting and consolidating events, but the tools involved do not all perform the same job.
Fluent Bit, Fluentd, Vector and the OpenTelemetry Collector gather data and move it into the pipeline.
Kafka, Logstash and streaming engines buffer, transform, enrich or route the data.
Elasticsearch, Grafana Loki, Splunk, Datadog and New Relic store, query, visualize and alert on the resulting logs, although their architectures and feature sets differ.
What separates a good architecture at scale is not how persuasive it looks in a demo. It is whether the system:
Collection is a mature problem. The gap appears after collection succeeds and volume continues climbing.
The instinctive moves—sample harder, ask developers to log less or drop data outright—solve the cost problem by creating a visibility problem.
That is not a trade most teams want. It only feels like the last lever available.
The better lever sits upstream, at the aggregation point, before repetitive data reaches the platform that indexes and bills for it. This is the principle behind first-mile log processing.
This is where Grepr’s Intelligent Operations Platform operates.
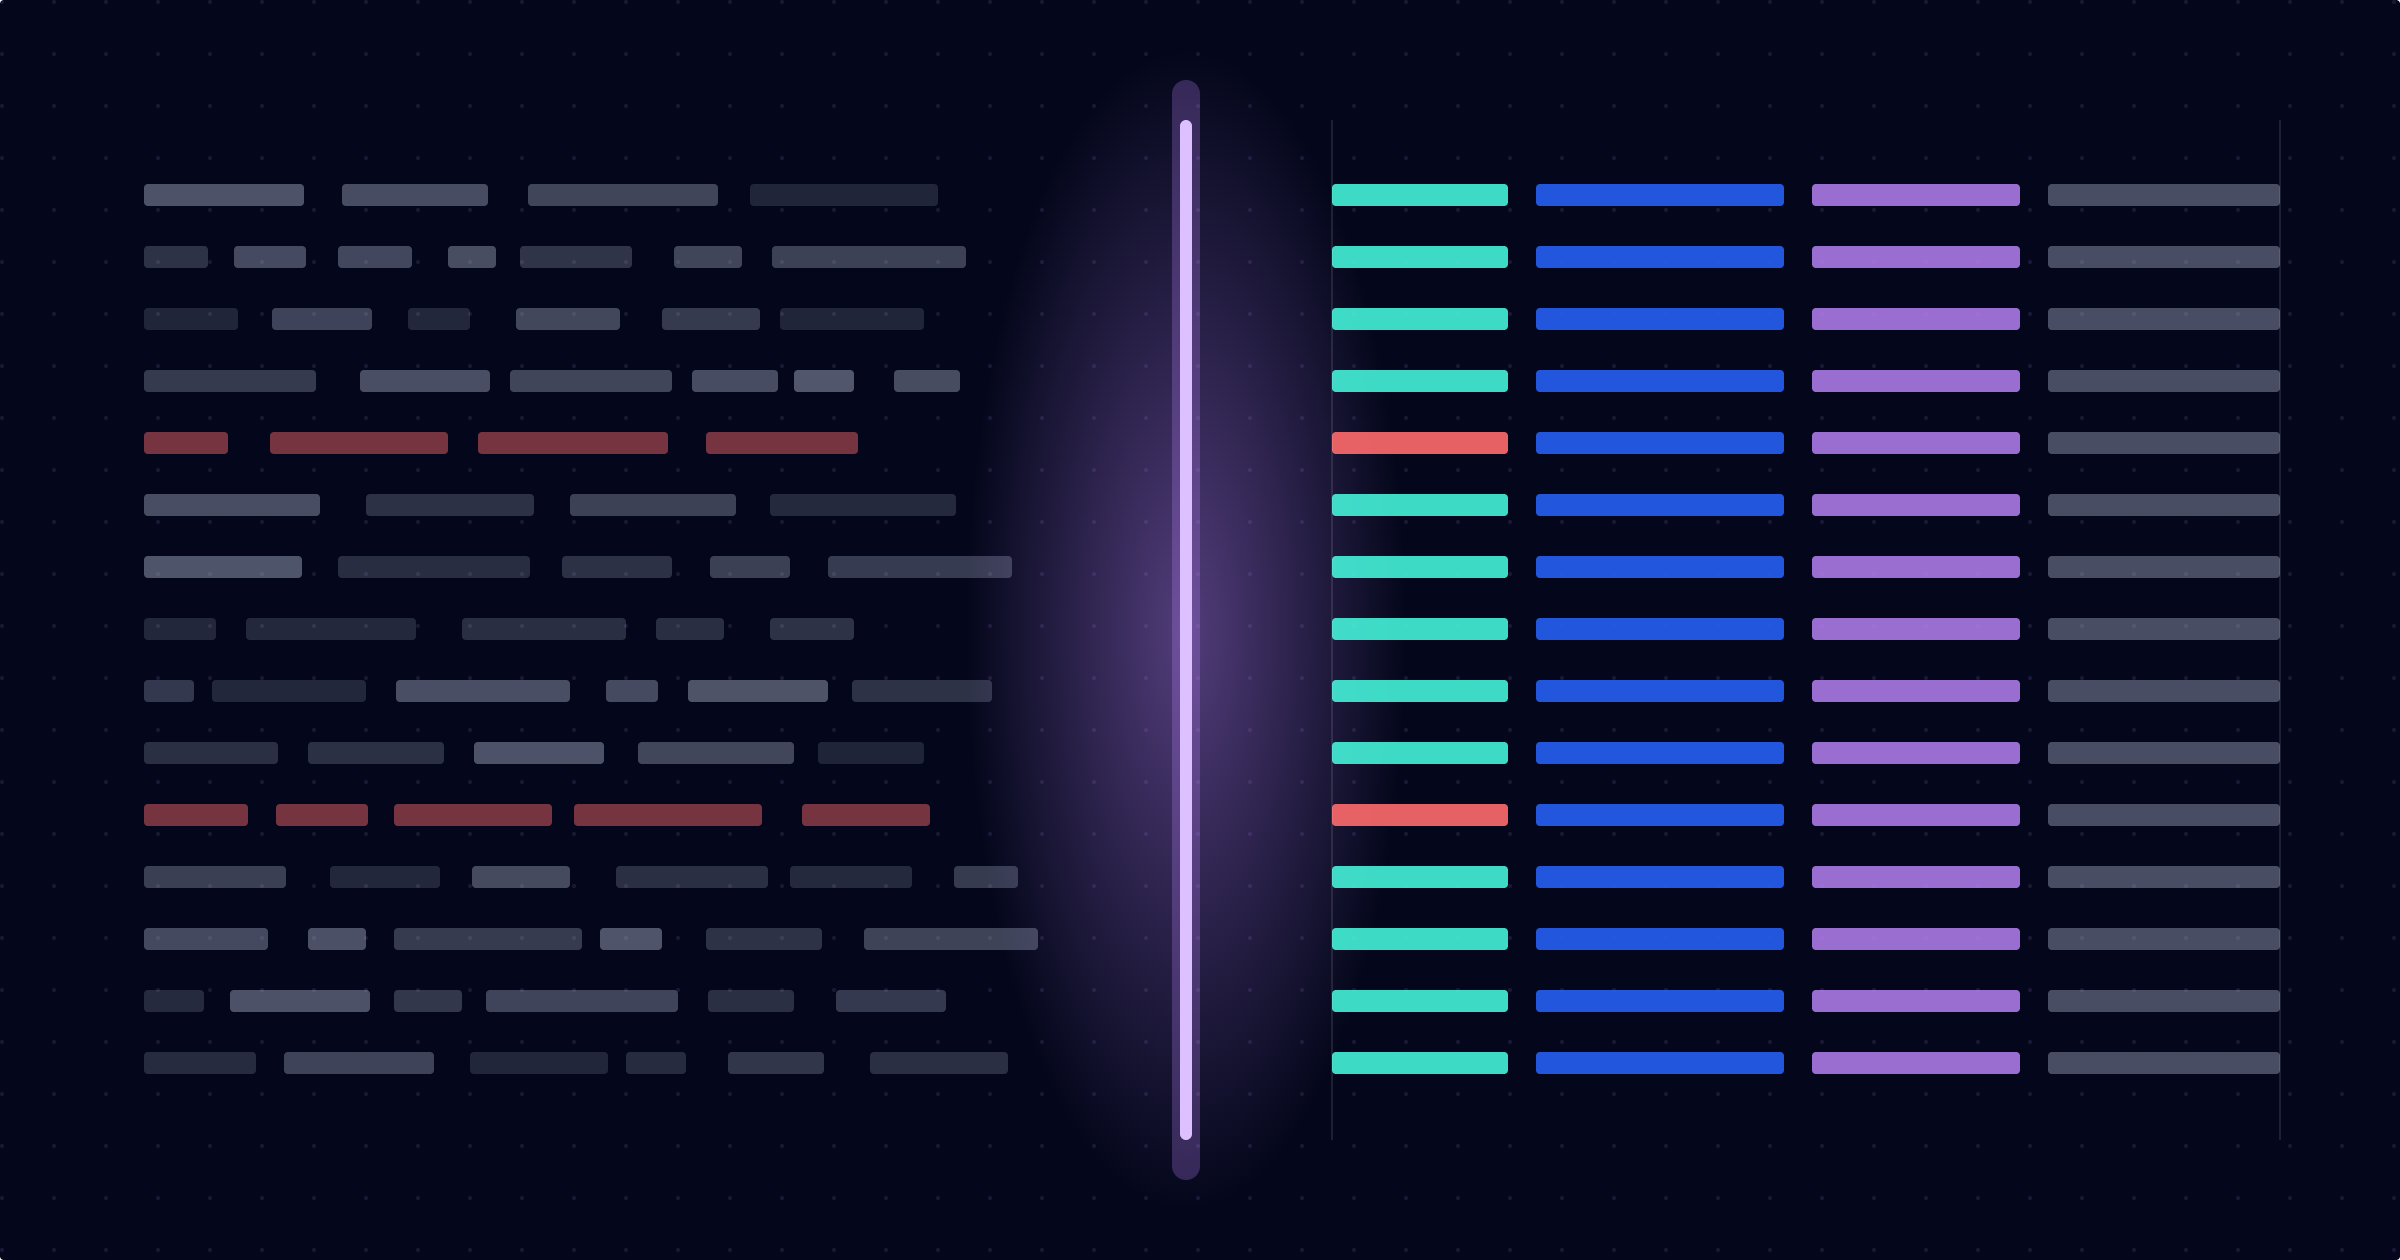
Grepr sits in front of tools such as Datadog, Splunk, New Relic or Grafana Cloud and identifies repetitive patterns as data moves through the pipeline. Unusual events continue downstream untouched. Repeated patterns can be summarized rather than duplicated thousands of times in a premium index.
The complete raw stream remains available in a low-cost log data lake and can be searched or backfilled when an incident or investigation requires it.
Grepr’s log reducer can reduce downstream observability volume by 90% or more, depending on the composition of the telemetry.
Jitsu reduced its Datadog log costs by 90% while managing millions of shipments, each generating hundreds of logs.
The team did not replace Datadog, rebuild its dashboards or ask its developers to rewrite their logging. It redirected its existing log shipper through Grepr and retained the complete raw data for its compliance requirements.
Same aggregation point. A more useful job for it to do.
Traditional log aggregation was designed to centralize data. It was not designed to control cost, cardinality and repetition automatically.
Adding that missing stage upstream allows teams to preserve visibility while paying premium rates only for the data that deserves premium treatment.
See the noise-to-signal split in your own pipeline before changing application code or starting a migration.
Log aggregation is the process of collecting logs from multiple applications, servers, containers and infrastructure components and consolidating them in a central location.
This gives engineering, security and operations teams one searchable dataset for troubleshooting, monitoring, auditing and incident response.
Aggregation moves distributed logs into one central destination.
Log management covers the complete lifecycle after collection, including parsing, indexing, search, retention, access controls, alerting, compliance and archival. Aggregation is therefore one part of a broader log management strategy.
Costs rise because more events must be transported, processed, indexed and retained.
Repetitive messages and high-cardinality fields can increase that work without adding equivalent diagnostic value. The exact impact depends on how the downstream platform charges for ingestion, storage, indexing, queries and retention.
High cardinality means a field contains a very large number of unique values, such as request IDs, pod names or user IDs.
These fields are useful during investigations, but at scale they can increase index size, memory use and query complexity in some logging platforms.
Not necessarily.
Grepr summarizes repetitive patterns before they reach the premium observability platform while preserving the complete raw stream in low-cost cloud storage. Teams can reduce downstream volume and still search or backfill the original data when an incident requires it.
No.
An upstream reduction layer can work in front of existing platforms such as Datadog, Splunk, New Relic and Grafana Cloud.
Grepr uses the current pipeline and destination tools, so teams can reduce downstream volume without rebuilding dashboards, retraining users or beginning a large migration.