Comparisons
Best Log Management Tools in 2026: A Realist's Buying Guide



Your log management bill keeps climbing every single quarter. Be honest. Is it because your app suddenly got twice as good? Probably not. There is a strong chance this is happening because your app got twice as noisy. Every new microservice, retry loop, and DEBUG line that someone forgot to turn off adds more digital garbage to the pile.
Right now, someone on your engineering team might be playing digital janitor. They are maintaining a messy, growing rulebook of drop filters and regex patterns just to keep your storage costs from exploding.
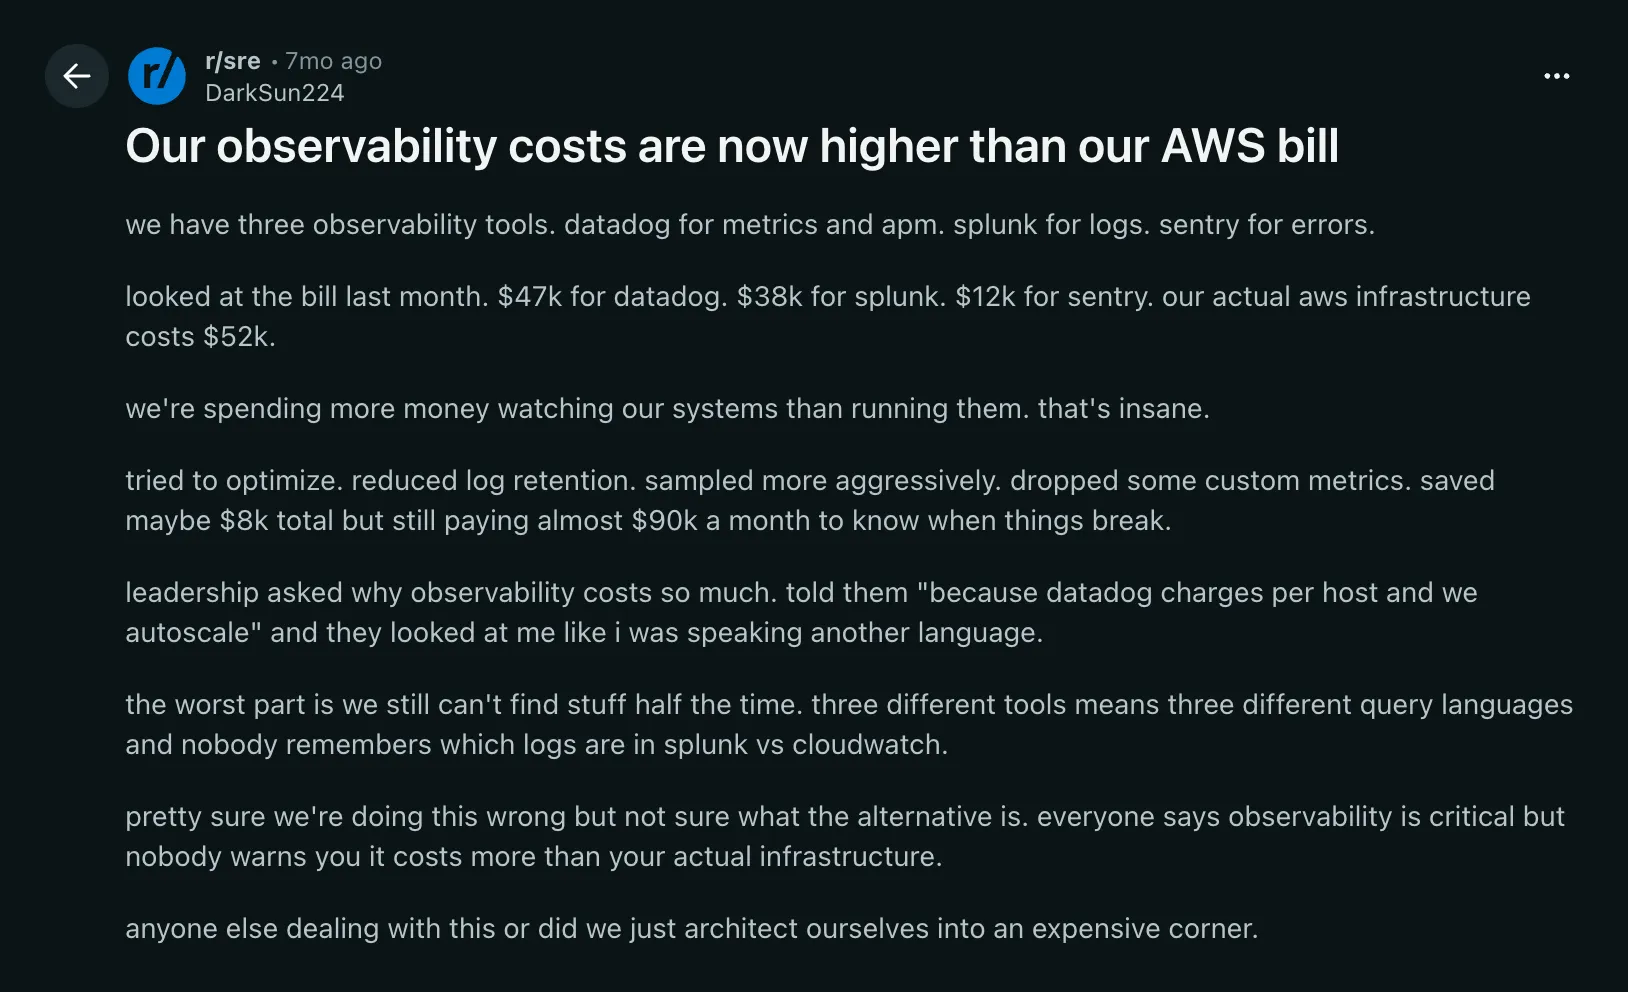
In public engineering forums, teams openly vent about this pain. You can read through real discussions on soaring observability costs where companies realize they spend more money watching their app than actually running it. It is a massive headache.
This guide focuses on the practical side of fixing it. We will look at 9 log management tools in 2026. This includes big SaaS platforms, open source setups, and smart tools that shrink your volume before it hits your database. We will look at what they do well, where the hidden costs live, and how teams actually view them.
What is a log management tool? Before diving into features, let's establish a baseline: what is a log management tool? At its core, it is the software framework—either cloud SaaS or self-hosted—that provides the user interface, storage engine, and query infrastructure to interact with your system's generated data.
When evaluating a log management system or logging software infrastructure, keep these core factors in mind:
Now let’s understand the top 9 log management tools:
Disclosure This guide includes Grepr, which is a tool built specifically to reduce log volume. We evaluate it right alongside 8 traditional log management platforms. The descriptions below are built from public documentation, pricing pages, and real engineering discussions.
Datadog is the giant all-in-one platform. It bundles logs, application traces, infrastructure metrics, and security under one single roof. If your team wants a single dashboard to see absolutely everything, this is usually the default choice.
Datadog is incredibly easy to set up and plug into your stack. The downside is that its modular pricing might feel like death by a thousand cuts. Engineers frequently share warnings about how quickly Datadog bills scale out of control when you start sending massive amounts of raw data without strict filters.
Splunk remains widely used in security operations and compliance-heavy environments. Its custom search language is fantastic for running complex correlations across massive corporate data piles.
If your main goal is deep security forensics, Splunk is brilliant. However, it is an incredibly expensive platform. The costs might rise aggressively with your data volume, and finding engineers who are experts in its specific language there is a strong chance you could pay a premium too.
The classic trio of Elasticsearch, Logstash, and Kibana is one of the most famous log management open source setups in tech history. Logstash gives you incredible power to clean, parse, and transform your logs before they get saved.
The catch is the operational tax. Running a large ELK cluster by yourself requires serious engineering skill. If you do not have a dedicated engineer who understands index design and shard management, there is a strong chance your cluster could eventually slow down and stall.
Grepr takes a totally different approach. It is not a full logging backend. Instead, it sits as a smart buffer layer right between your apps and your existing log monitoring tools. It works with platforms you already use like Datadog, Splunk, or Grafana.
Its core job is to automatically stop repetitive, low-value log lines from reaching your main database. It still keeps the full, raw logs saved safely in cheap, open formats in case you need them for a deep audit later. This is a smart option if you love your current tool but absolutely hate your current bill.
Loki is an open source tool built specifically to work alongside Grafana and Prometheus dashboards. Unlike Elastic, Loki does not index the full text of your logs. It only indexes the labels.
This unique design makes Loki incredibly cheap to run because it stores data in basic, low-cost cloud storage. But there is a major tradeoff. Experienced teams warn that bad label design will ruin your search speeds. If you try to run broad text searches across long time frames, your queries might easily time out.
Graylog is a reliable open source option that gives you great parsing pipelines without the high cost of corporate SaaS. It is an excellent middle ground for teams that want structured logs but prefer to self-host.
Keep in mind that Graylog still relies on database layers like OpenSearch underneath the hood. You save money on software licensing, but there is a strong chance you could still face the hardware and maintenance bill to keep those underlying databases healthy.
SigNoz is an open source platform built directly on OpenTelemetry standards. It combines your logs, metrics, and traces into a single view. It is a highly popular option for modern teams that want to avoid proprietary vendor lock-in.
You can run it yourself or use their managed service. Just remember that open source does not mean free labor. If you choose the self-hosted path, your team still owns the time it takes to manage the infrastructure.
New Relic started out focused purely on application performance monitoring and later grew into a full logging platform. It makes it very easy to jump directly from a broken line of code to the exact log line that caused the error.
They offer a generous free tier that smaller startups love. As your company grows and your logging software volume increases, the pricing still shifts based on data ingestion, which means you still might have to watch your traffic levels closely.
Better Stack mixes log management with uptime monitoring, status pages, and on-call scheduling alerts. It uses standard SQL for its search engine, which means your developers do not have to learn any weird new languages to use it.
It is a fantastic fit for smaller engineering teams that want to get up and running quickly without buying four separate products. The bundle is convenient, though it might offer less standalone modular flexibility than the major observability giants.
When you look past the shiny vendor marketing pages, the consensus among working engineers is pretty clear. No single tool wins on every front. Every choice is a direct trade-off:
Log management is the collective process of gathering, parsing, indexing, and storing log data over time. Think of it as your digital filing cabinet. It handles the backend infrastructure so you can search through historical records whenever you need to perform audits or trace past events.
Log monitoring is the active, real-time layer built on top of your logs. If management is the filing cabinet, log monitoring is the active alarm system. It continuously watches the incoming data stream as it happens to instantly spot bugs, errors, or security threats the second they emerge.
Log aggregation is the critical first step of the pipeline where raw data is gathered from dozens of different places—like your servers, apps, and routers—and routed into a single, central highway. Teams use lightweight shippers like fluent bit to do this heavy lifting before the data is handed off to your primary tools.
Platforms like datadog, splunk, and logstash all have built-in tools to filter your data. The catch is that they require manual setup; your team has to constantly update your filtering rules by hand as your software changes. Tools like grepr solve this by automating that reduction step before the data ever hits your main platform, reducing reliance on manual filters and complex rule books.
Because we highlighted Grepr earlier, let us look at the exact numbers working teams see in production. It acts as an efficient data buffer, and the real-world metrics speak for themselves:
Grepr can be deployed as a simple multi-tenant SaaS tool or completely inside your own AWS VPC for teams with strict HIPAA, SOC II Type 2, or GDPR compliance needs. It serves as a great example of how engineering teams in 2026 are separating their data ingestion from their data storage to protect both their budgets and their system performance.
When you make your final decision, ignore the flashy marketing features and the sales pitches. Focus entirely on the operational reality. Look closely at the pricing model, calculate the engineering time required to maintain the system, and test how easily your team can write queries. Most importantly, make sure you have a clear strategy to manage your log volume. Controlling the sheer amount of data you create is the single best way to protect both your budget and your sanity.
Click here to try Grepr.