

Optimize your observability platform
Grepr is the Autonomous Telemetry Pipeline that automatically reduces 90% of your telemetry noise without migrations or disruption to existing dashboards and alerts.
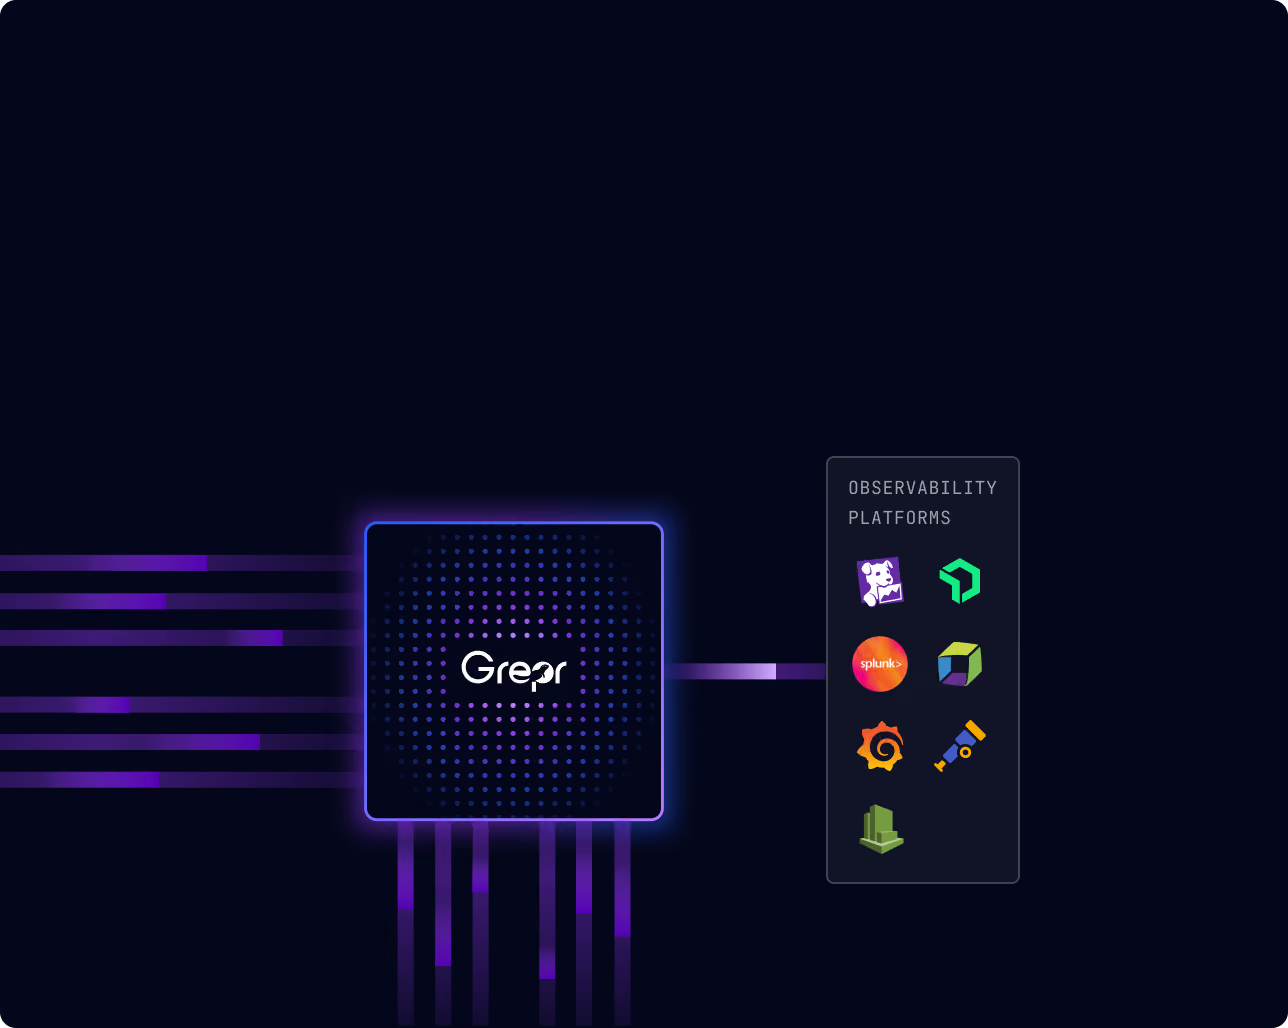
Grepr works with Datadog, New Relic, Splunk, Dynatrace, Grafana, OpenTelemetry, AWS Cloudwatch, and more.
Your observability platform isn’t the problem. It’s the expensive, noisy telemetry you don’t use.
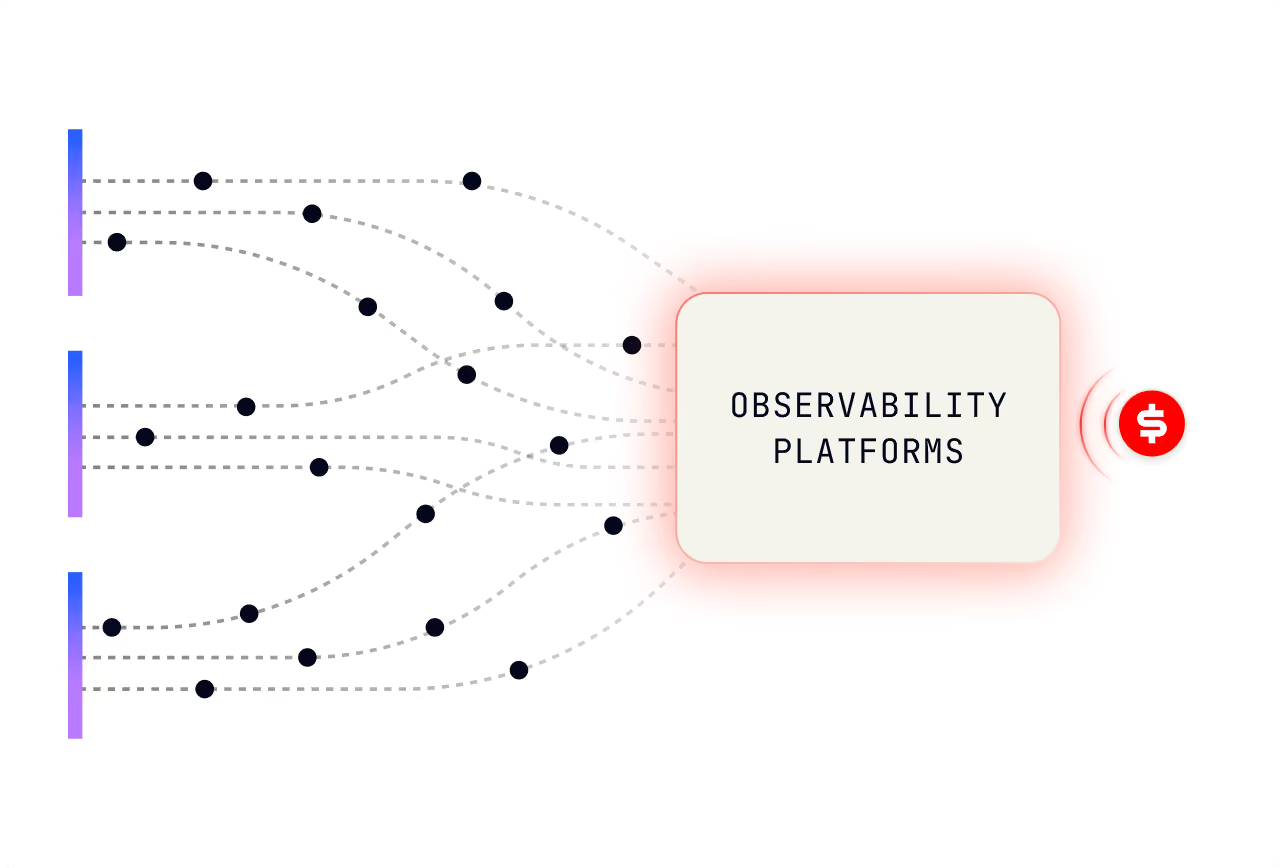
Engineering teams ship more services, more background jobs, and more debug events. And AI-assisted development accelerates the pace in a way that’s unsustainable. Your observability bill compounds as your telemetry data grows.
Cut observability costs without losing visibility
We guarantee a 75% reduction in your observability TCO. Raw data remains available in low-cost storage for querying or automatic backfill during an incident.
How Grepr solves the limitations of traditional approaches
Instead of collecting less
Creates blind spots, and developer adherence is inconsistent.
Collect as much as you want, and let Grepr separate the signal from the noise.
Instead of shortening retention
Creates blind spots during outages, and compliance may mandate longer retention.
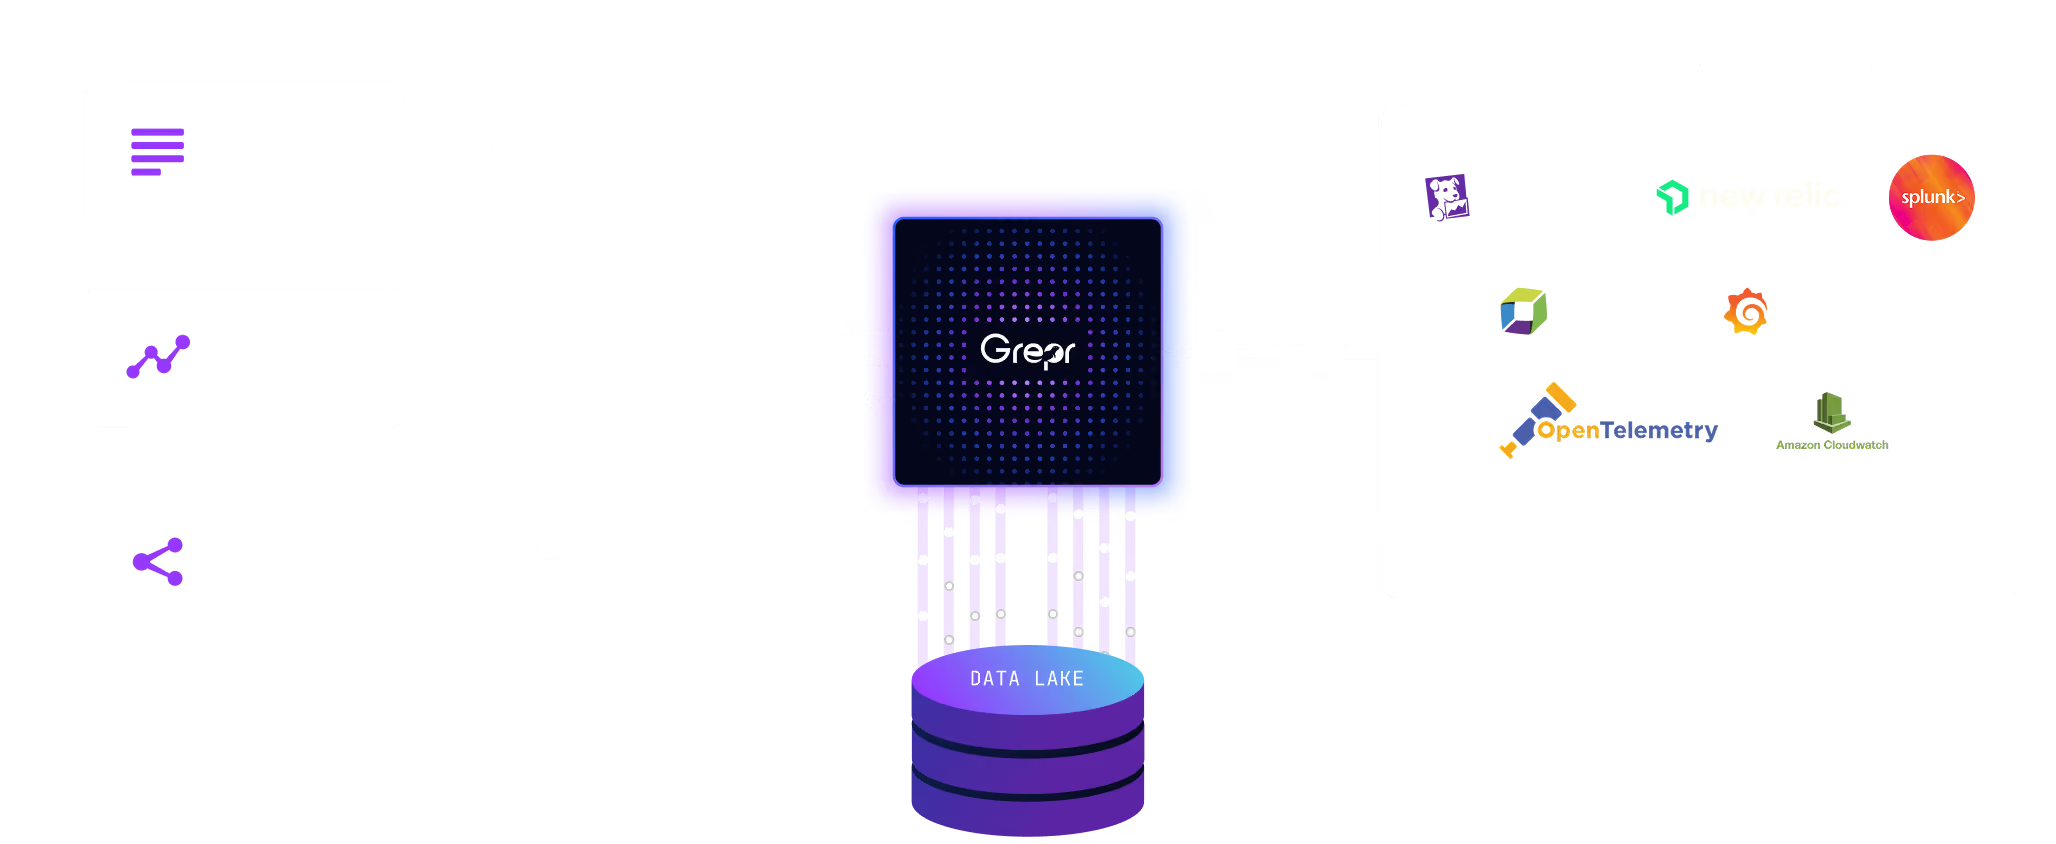
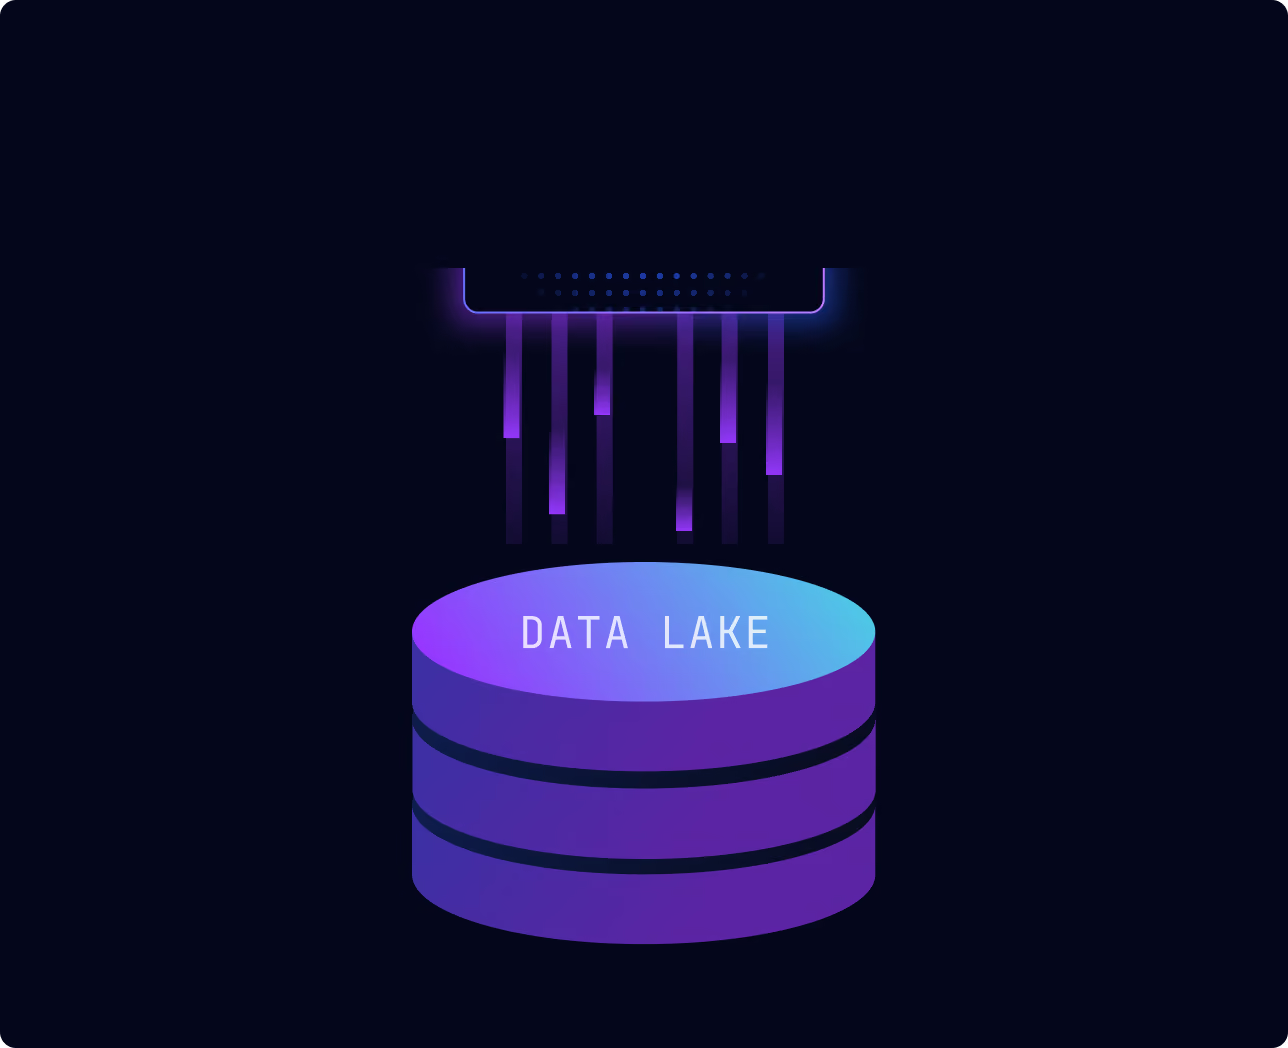
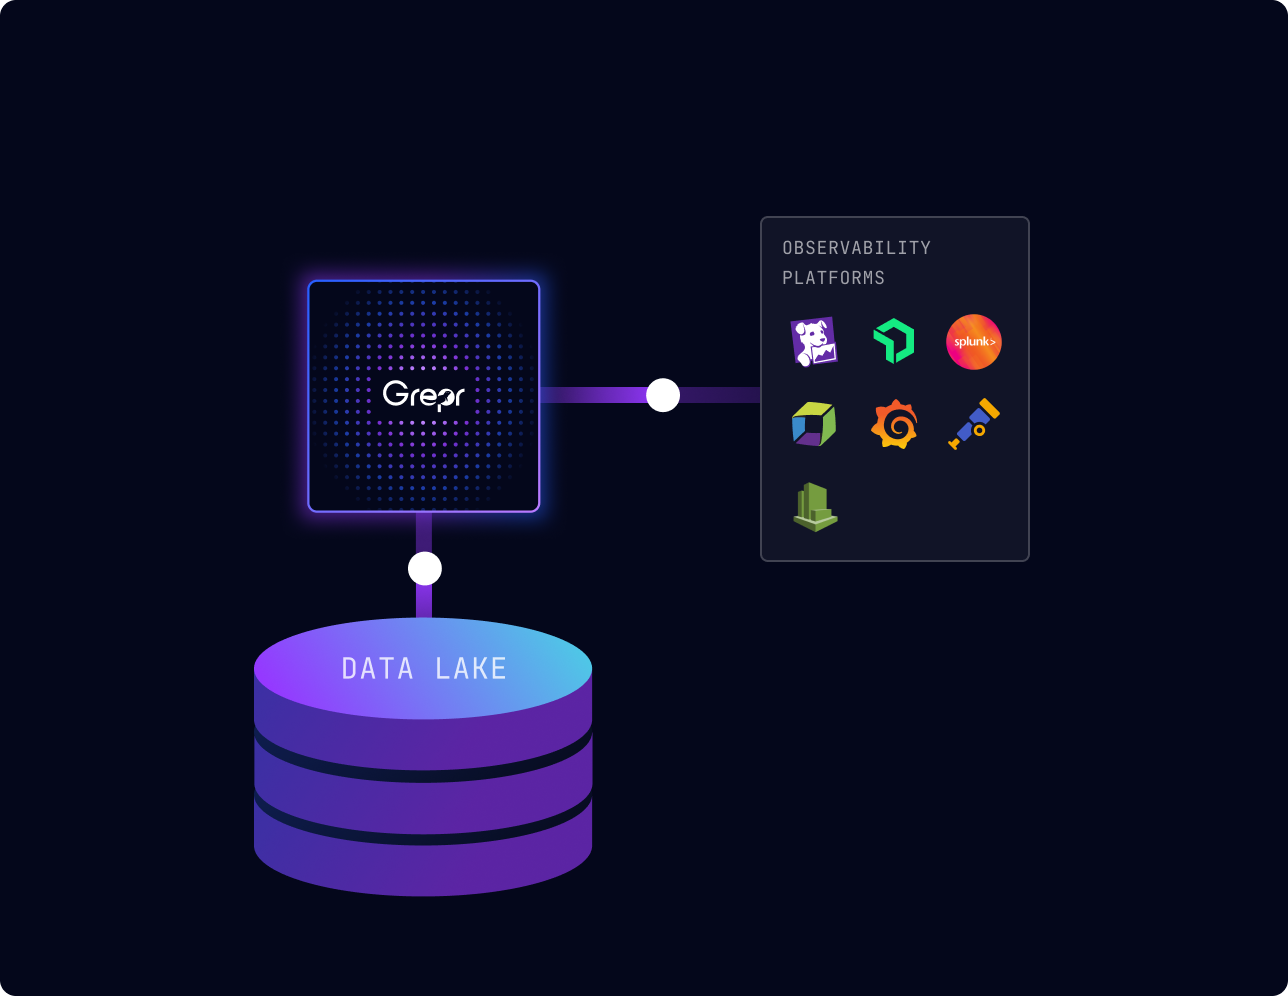
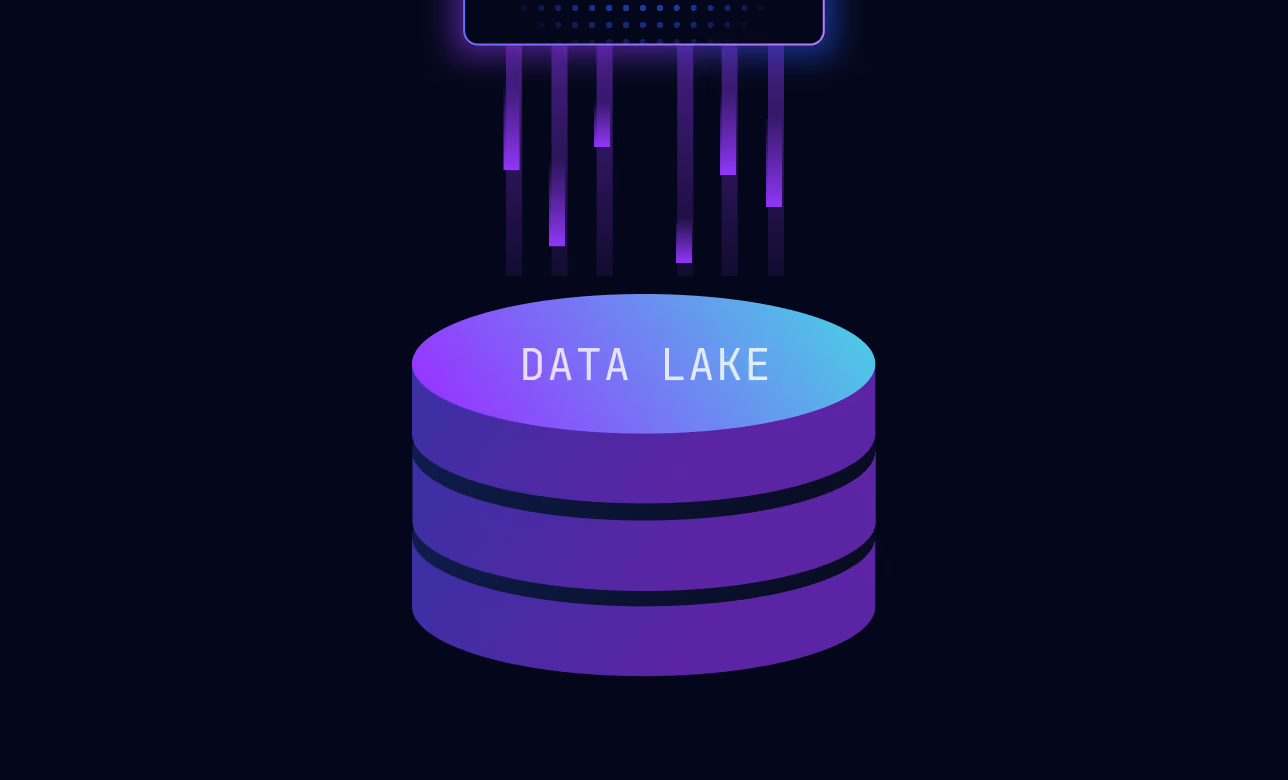
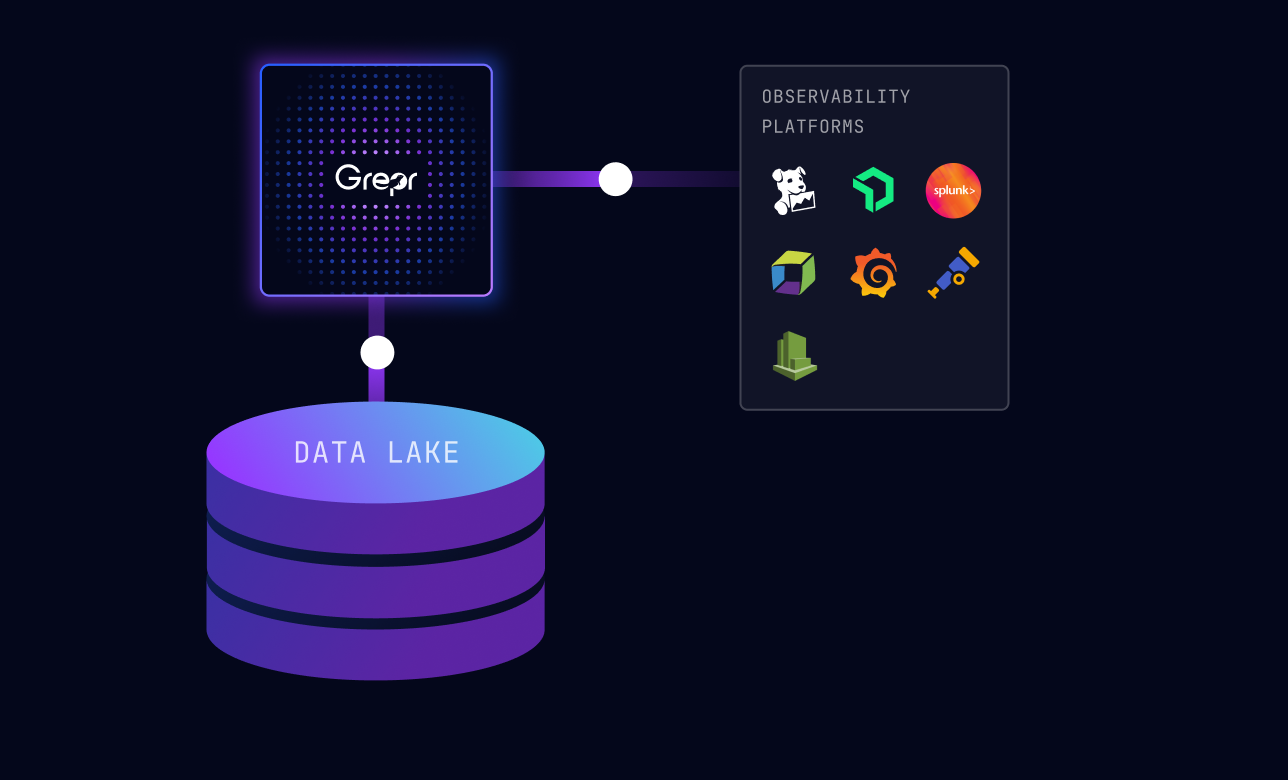
Keep raw telemetry in a low-cost data lake and back-fill data to assist investigations.
Instead of sampling or dropping data
Requires months of engineering resources, and arbitrary dropping leads to blind spots.
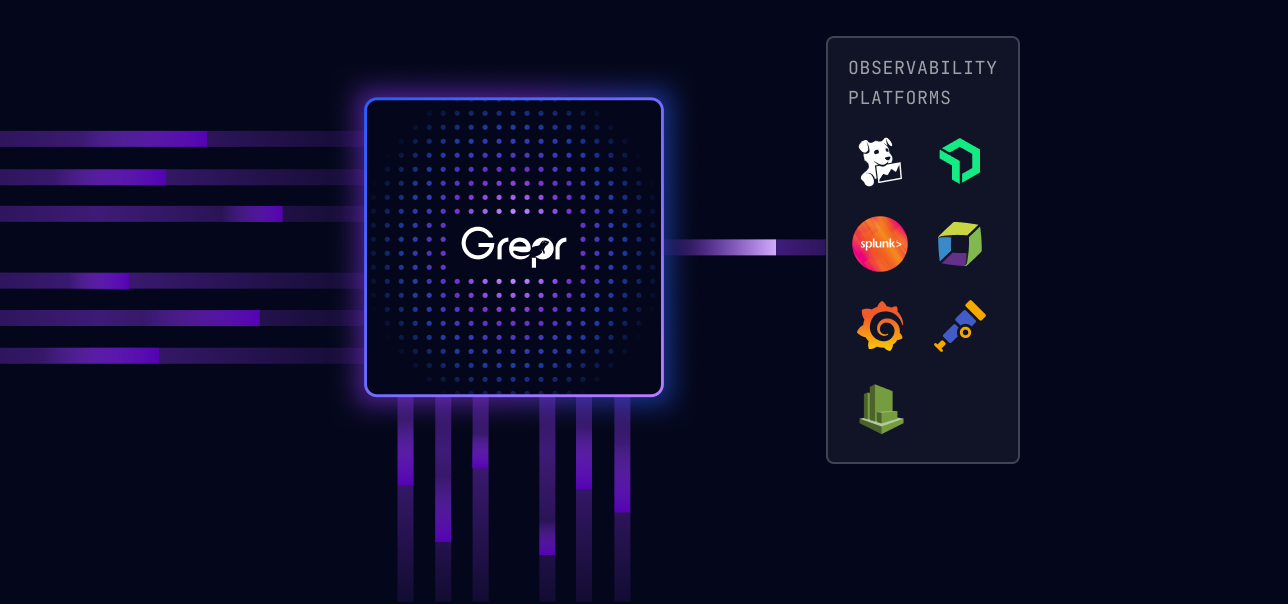
Collect everything and let Grepr’s signal processing engine automatically separate signal from noise.
Instead of observability reviews
Observability cost reviews and quota negotiations slow down deployments.
Collect everything and ship now.
How to optimize observability with Grepr
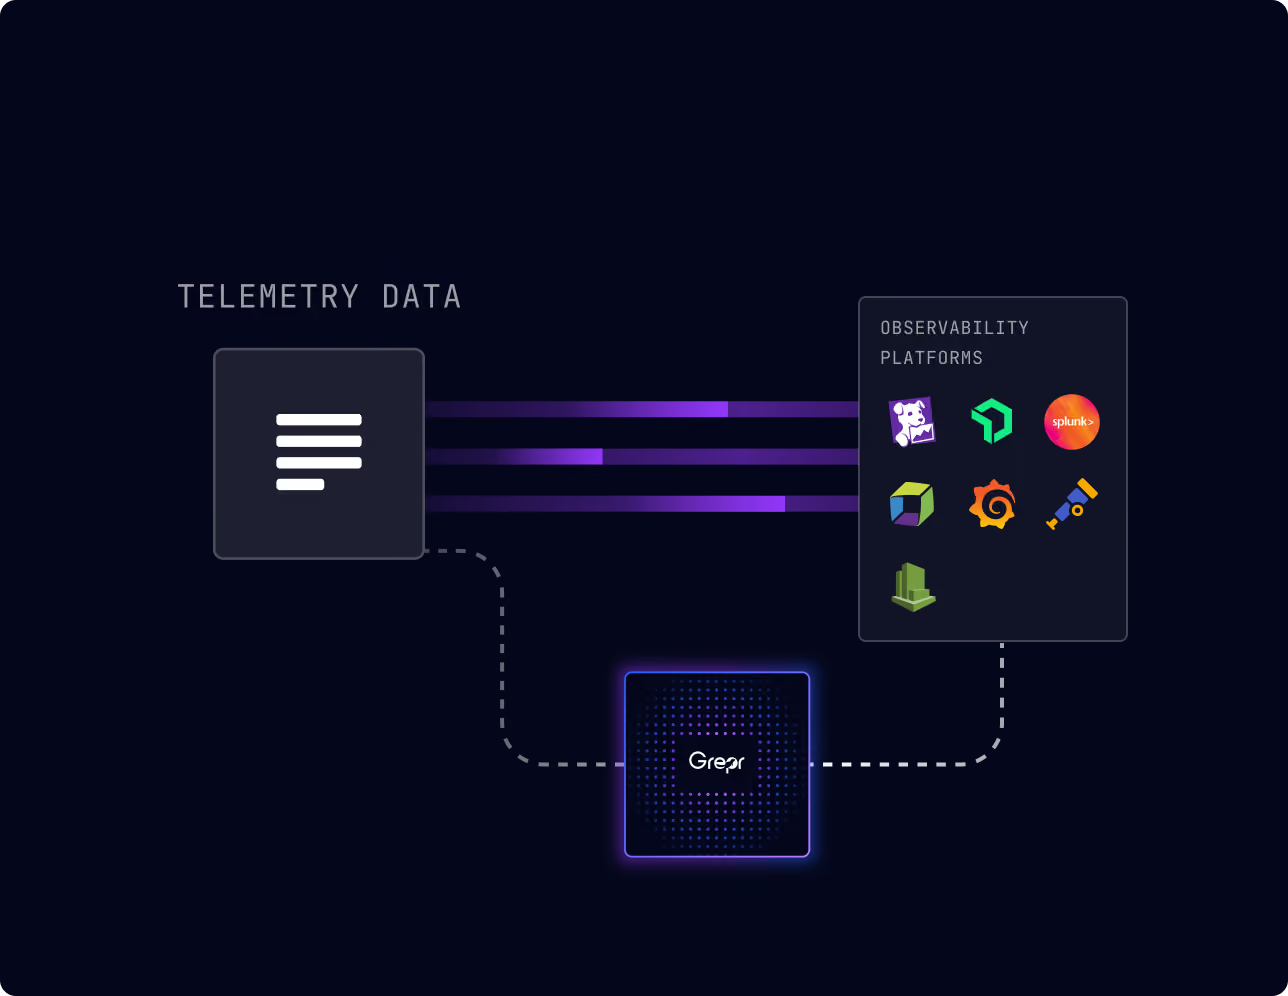
Keeps using your observability platform as you always have. Your Dashboards, alerts, runbooks, and investigations stay connected to the same workflows.


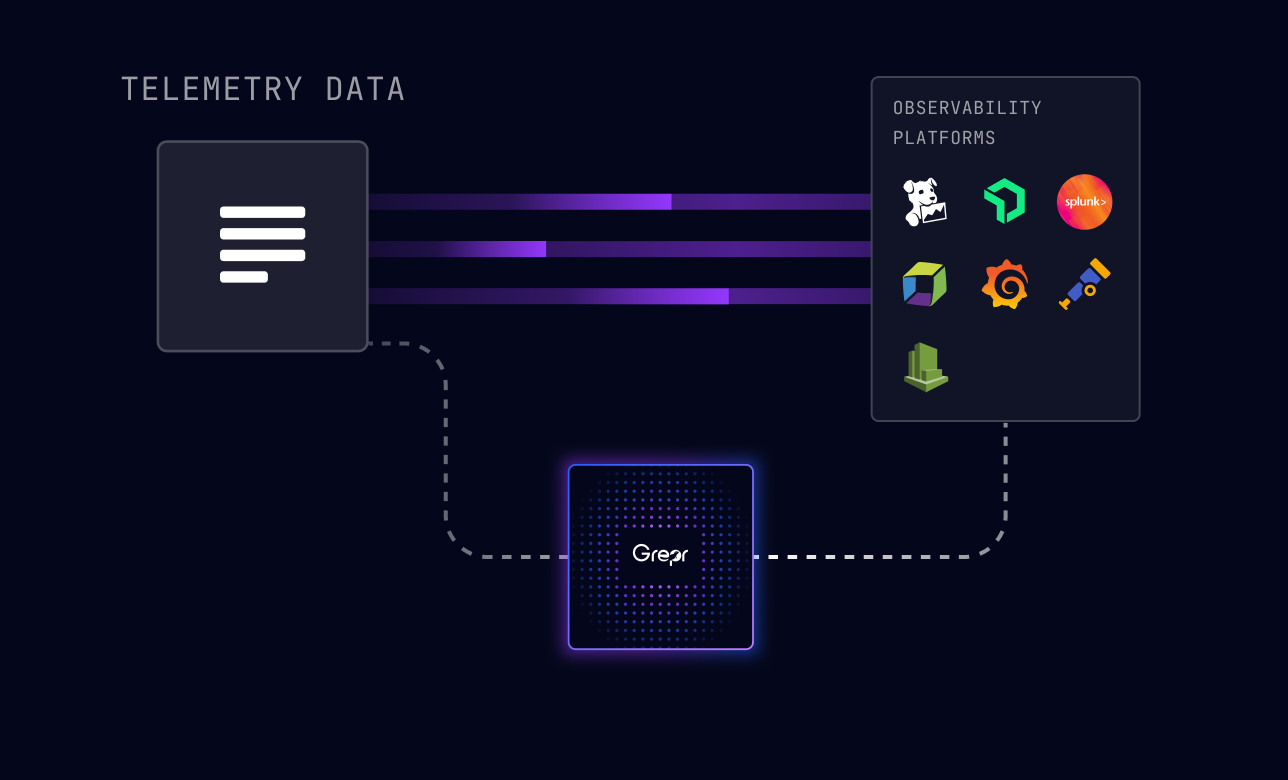
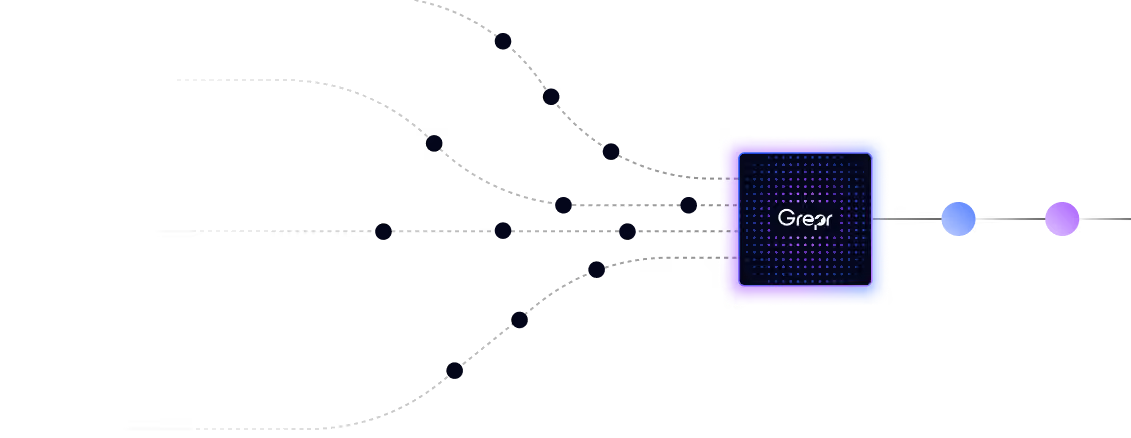
Grepr sits between your telemetry sources and your observability platform
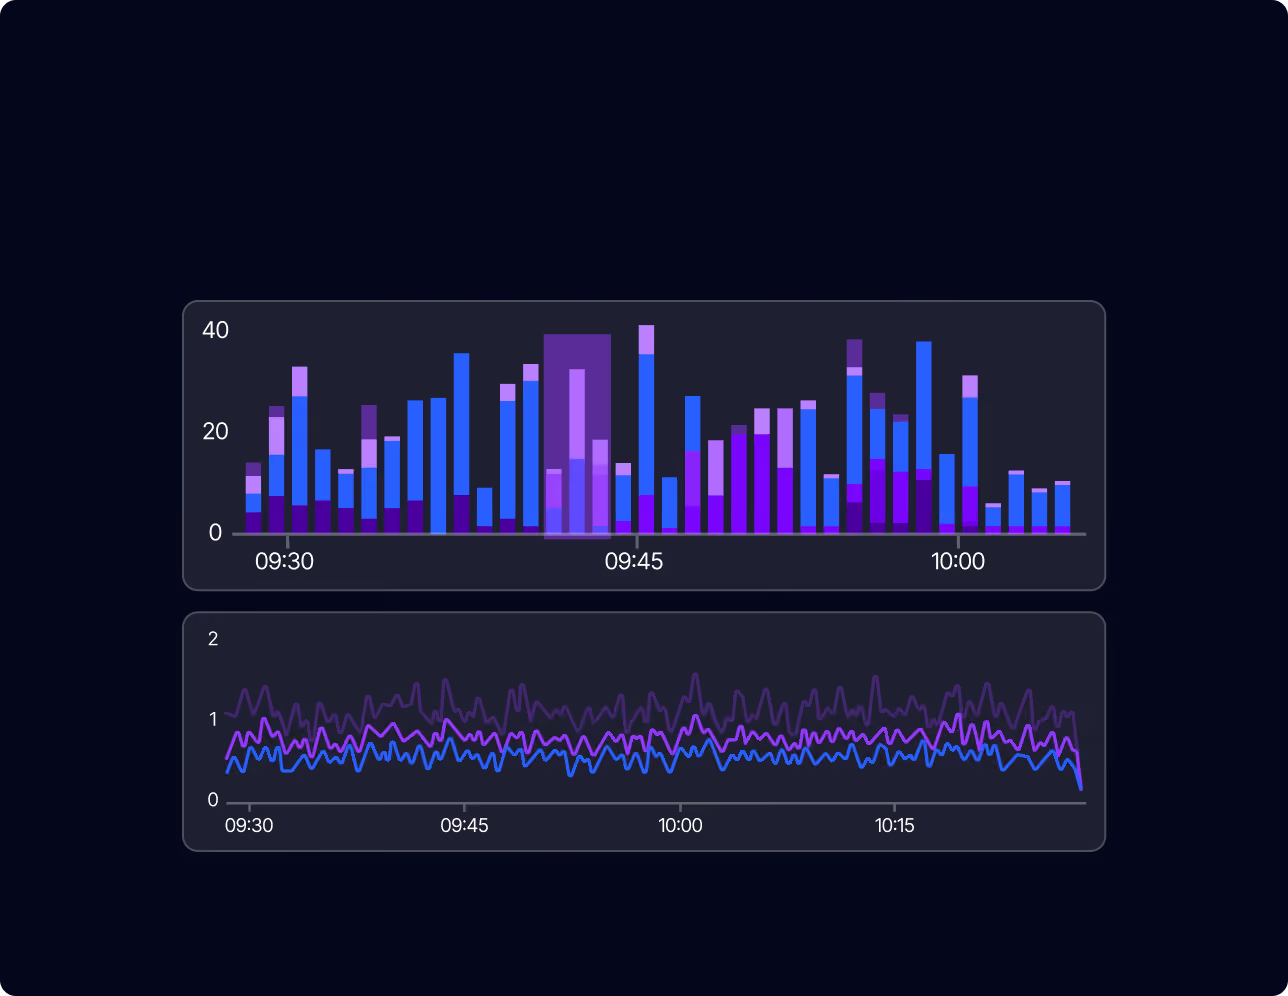
For example, sending patterns such as request failed for user <*> while preserving configured fields and exceptions.
----
----
.avif)

Lower Bills. Same visibility. No compromise.
Grepr is not an observability alternative. Keep using your platform exactly as you always have.
Grepr’s signal processing engine automatically eliminates telemetry noise before it reaches your observability platform.
Grepr detects millions of patterns, signatures, and trends dynamically. No toilsome rule-building. No log audits. No routing rules to update each sprint. No policing log volumes.
As you ship more software and produce more telemetry, Grepr scales with you, automatically identifying noisy telemetry in real time.
Eliminate observability noise in production

“We were skeptical that something could reduce our log volume that aggressively without us feeling it somewhere. The fact that our developers haven't noticed a change in how they work is the result we were hoping for.”


How CustomInk Cut Their CloudWatch Bill by 85% Without Impacting Dev or Ops

"Grepr helped us automate what to keep and what to skip, so we’re not paying to store or index noise. It lets us find the needle in the haystack without paying for the haystack!"


How Jitsu Cut Logging Costs by 90% While Managing Millions of Shipments Generating 400 Logs Each

"Since we deployed Grepr, we’re seeing a 95% reduction in log volume and didn’t have to change a thing in our app. I'd recommend Grepr to any team that's experiencing rising costs from an expensive logging platform!"
.webp)

Case Study: How FOSSA Reduced Their Logs by 95% Without Burdening Their Engineers

“Engineers didn't change how they work at all. Dashboards and alerts still worked as expected. We just stopped paying for 90% of our log volume that was never doing anything for us.”

9 Days from Kickoff to Production: How Envoy Cut Log Volume by 90%
“After seeing what Grepr did to reduce our logs noise, extending it to traces was an easy call. We were seeing the same pattern: a lot of volume, most of it not particularly useful, and a Datadog billing model that scaled with every new host we spun up.”

How FOSSA Reduced Distributed Trace Volume by 90%
“We were skeptical that something could reduce our log volume that aggressively without us feeling it somewhere. The fact that our developers haven't noticed a change in how they work is the result we were hoping for.”
"Grepr helped us automate what to keep and what to skip, so we’re not paying to store or index noise. It lets us find the needle in the haystack without paying for the haystack!"
"Since we deployed Grepr, we’re seeing a 95% reduction in log volume and didn’t have to change a thing in our app. I'd recommend Grepr to any team that's experiencing rising costs from an expensive logging platform!"
“Engineers didn't change how they work at all. Dashboards and alerts still worked as expected. We just stopped paying for 90% of our log volume that was never doing anything for us.”
“After seeing what Grepr did to reduce our logs noise, extending it to traces was an easy call. We were seeing the same pattern: a lot of volume, most of it not particularly useful, and a Datadog billing model that scaled with every new host we spun up.”


FAQ
Typically up to 90%, but it depends on how noisy your telemetry is. Teams running chatty services, health checks, retry loops, debug logs, and repeated lifecycle events tend to have more reducible volume. Jitsu reduced log costs by 90% with Grepr, and FOSSA saw a 95% reduction in log volume without changing their app. Book a demo for an estimate based on your actual environment.
Grepr is vendor-neutral. It works with Datadog, New Relic, Splunk, Dynatrace, Grafana Cloud, Amazon CloudWatch, OpenTelemetry collectors, and common log forwarders. If your telemetry can be shipped over a standard protocol, Grepr can sit in front of it.
No. Grepr is not a replacement for Datadog, New Relic, Splunk, Dynatrace, Grafana, or CloudWatch. It sits upstream of whatever you already use. High-value signal is automatically forwarded to your platform, and you keep using it exactly as you always have.
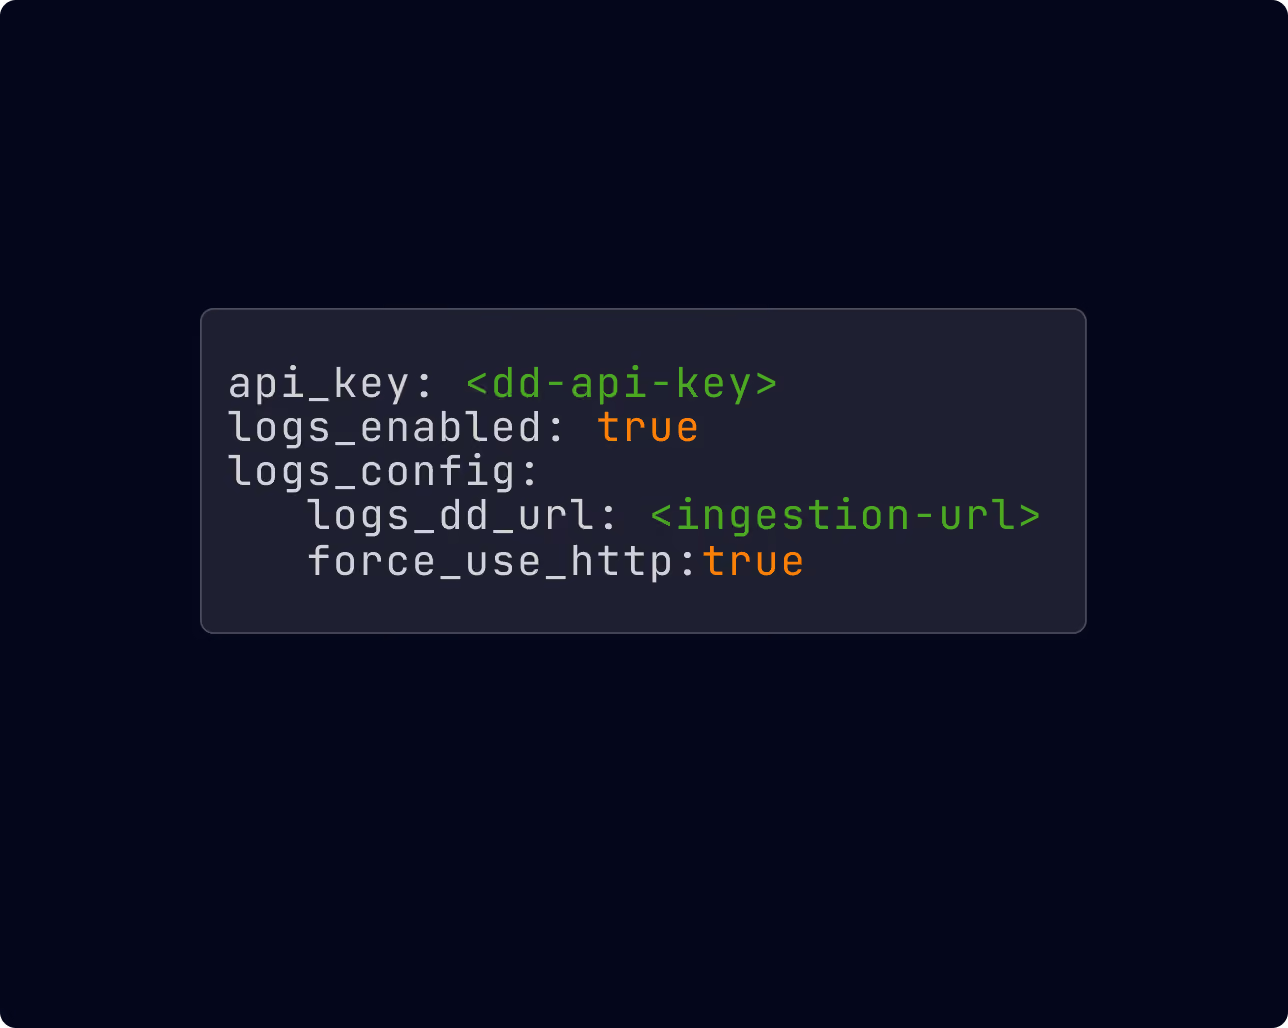
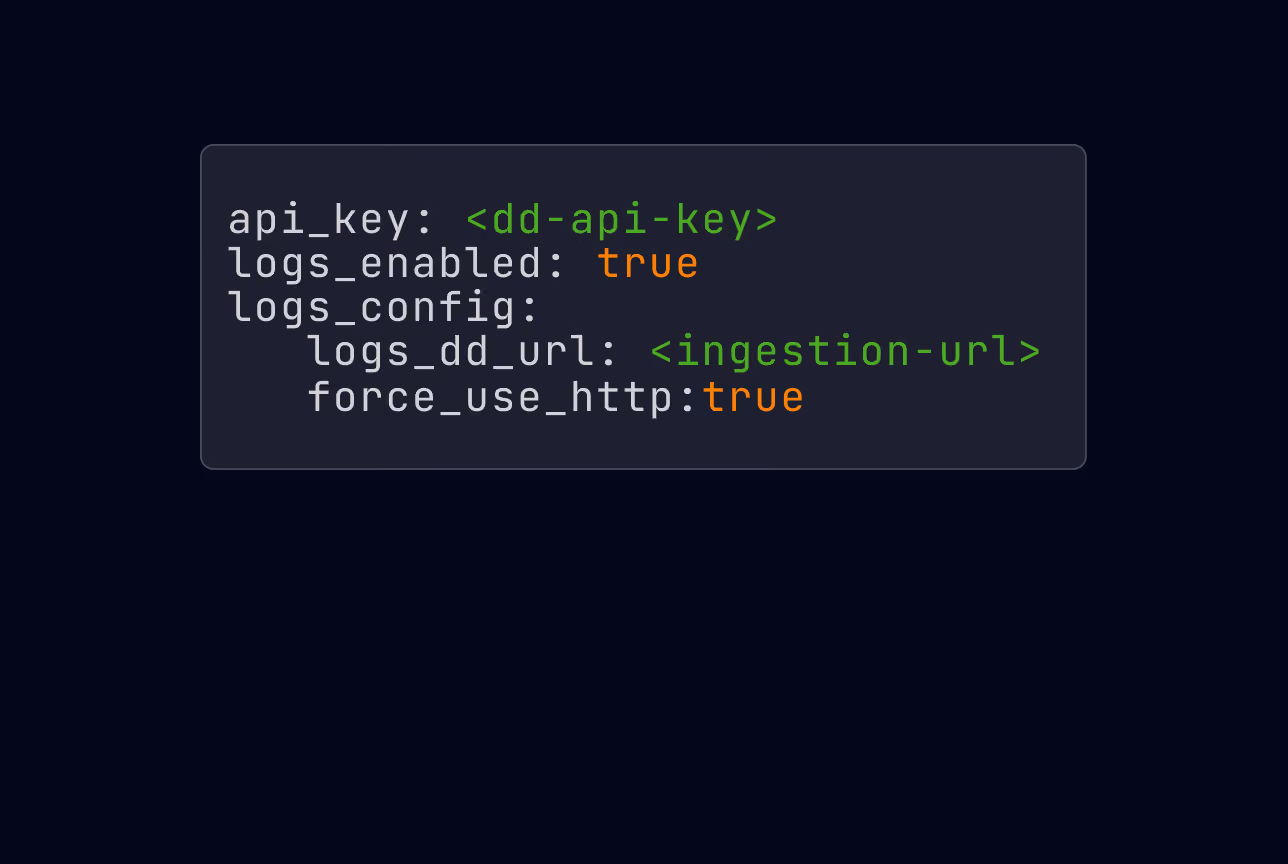
A single configuration change points your existing agents, collectors, or log shippers to Grepr — the Datadog Agent, New Relic agents, Splunk forwarders and HEC endpoints, Dynatrace OneAgent, the OpenTelemetry Collector, Fluent Bit, Vector, and similar. No agents to install, no re-instrumentation, and no migrations.
Grepr preserves raw data in low-cost storage for backfill and incident investigation. Nothing is thrown away.
Yes. Grepr's query translation engine reads your existing dashboards and alerts and automatically ensures the data they depend on is routed through — regardless of which platform they live in.
No. Sampling usually selects a percentage of events and drops the rest. Instead, Grepr's signal processing engine detects repetitive, low-value patterns, forwards summaries and high-signal telemetry to your observability platform, and preserves raw data in low-cost storage for backfill and incident investigation.
Yes. Grepr also supports distributed tracing, with metrics support anticipated in summer of 2026. That applies across platforms, whether you're paying for Datadog APM, New Relic compute units, Splunk ingest, Dynatrace DDUs, or CloudWatch ingestion and custom metrics.
Yes. Grepr sends interesting log patterns to your observability platform and preserves the noisy logs in low-cost storage for backfill and incident investigation.
Grepr can manually or automatically backfill data based on triggers such as incidents, anomalies, support tickets, or investigations.
Yes. Grepr stores raw telemetry in S3, and several platforms can query it in place — Datadog's Log Explorer, New Relic Federated Logs, and Splunk Federated Search for Amazon S3 all read directly from S3. No separate dashboard, no new query language, no retraining your team. The Grepr UI is still there for building pipelines and managing signal processing logic, but for day-to-day investigation your team never has to leave the tool they already use.
Grepr can be set up in minutes using a single configuration change that points your existing agents, collectors, or log shippers to Grepr. No agents to install, no re-instrumentation, and no migrations. Most teams are live in about 30 minutes.
No. Your existing controls — Datadog exclusion filters, New Relic drop rules, Splunk ingest actions, and their equivalents — stay useful. Grepr adds an upstream layer that changes the volume and shape of telemetry before it reaches your observability platform.
Save 90% on your observability platform bill
Show us your log patterns, trace signatures, and metric trends, and we'll show you how Grepr can reduce your noise.