Engineering Guides
What Is Log Parsing? How Modern Log Parsers Work


For most of computing history, if a machine produced a message, a human had to teach another machine how to read it. An engineer studied a raw log line and wrote a rule: the first part is the timestamp, the next word is the severity, and anything following user= is the user ID.
This was log parsing by hand.
It worked because systems were smaller and predictable. As long as the application kept speaking in exactly the same way, the parser worked.
But software rarely continues speaking in exactly the same way.
A developer renames user_id to account_id. A team changes its timestamp format. A new application sends JSON while an older service still produces plain text. A multiline error arrives looking nothing like the sample used to build the rule.
The parser may not raise an alarm. It may simply stop extracting a field. The dashboard remains open and everything looks normal until someone searches for an error the system can no longer recognize.
Traditional parsing requires engineers to predict every format and update the rules whenever reality changes. Across hundreds of services and containers, that becomes a permanent maintenance job.
Modern log parsing asks a different question: can the telemetry pipeline detect patterns as they appear?
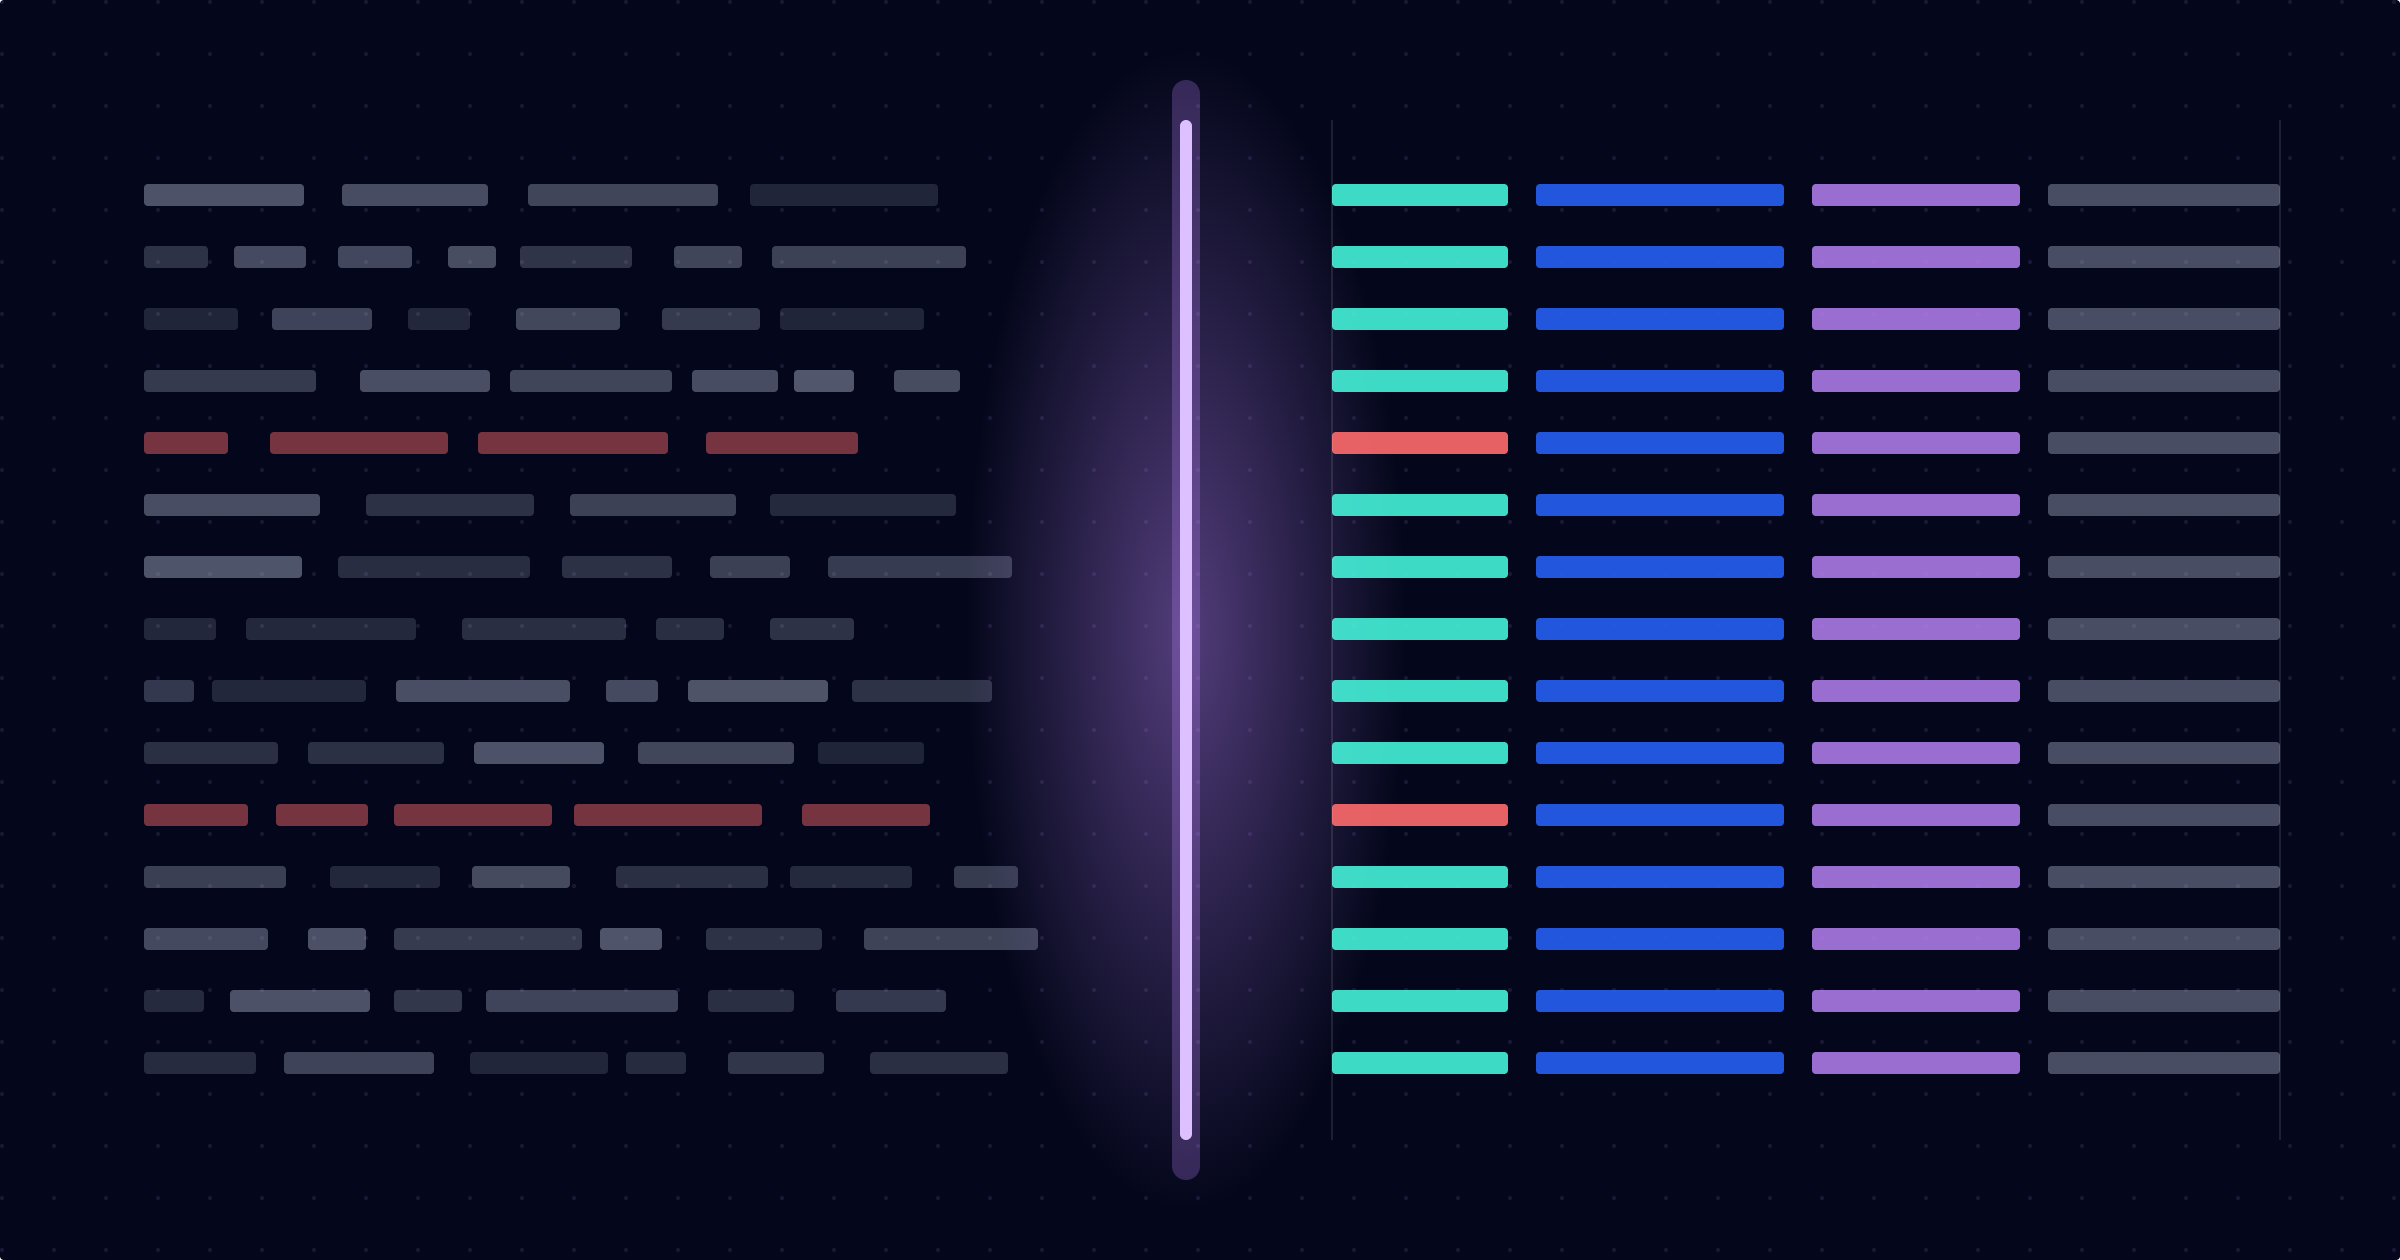
Log parsing is the process of turning a raw log message into clearly labelled fields that software can search, compare and analyse.
Take this log line:
2026-08-24 02:14:07 ERROR checkout failed user=1842 order=991
A person can understand it. A machine needs the information separated:
{
  "timestamp": "2026-08-24T02:14:07Z",
  "severity": "ERROR",
  "event": "checkout_failed",
  "user_id": "1842",
  "order_id": "991"
}
Once those fields exist, a team can search for every failed checkout, count errors by service, trigger an alert or connect the event to a trace. A line of text has become data that can participate in an investigation.
The OWASP Logging Cheat Sheet says useful event records should answer four basic questions: when, where, who and what. Parsing is what turns those answers into fields a system can search instead of words trapped inside a message.
Imagine checkout failures begin at 2:14 a.m.
The payment service records the customer as user_id. The order service calls the same person account. One application uses UTC while another records local time. The error from a third service is buried inside an unstructured sentence.
All three systems recorded what happened, but the engineer cannot search them as one story. Parsing has become part of incident response.
Good parsing helps teams answer practical questions:
NIST’s Guide to Computer Security Log Management places logs within incident response, system integrity and audit work. Teams need processes that make those records usable when something goes wrong.
A log parser usually performs five connected tasks.
The parser determines whether an event is JSON, CSV, syslog, plain text or another format.
It separates values such as the timestamp, severity, message, service name, user ID and trace ID, often using regular expressions, Grok patterns or source-specific rules.
Extracted text may need to become a date, number or Boolean value. Timestamps also need known timezones so events can be ordered correctly.
Normalization maps fields such as user, user_id and accountId into one shared name.
The pipeline may add its environment, team, region, container or deployment version.
Google Security Operations provides a useful production example. Its parsers contain instructions that map values from raw logs into fields in a common data model. Unmapped values can remain in the raw record even when they do not appear in the normalized event. Google’s parser overview shows why extraction and normalization must be designed together, without pretending they are the same task.
These three processes are related, but they are not identical. Parsing extracts what is already inside the message. Normalization turns different names and formats into a shared model. Enrichment adds context that was not present in the original event.
It is tempting to say, “We use JSON, so this is already solved.”
JSON provides structure, which is a very good start. It does not guarantee agreement.
Two teams can produce valid JSON while using different field names, timestamps and severity values. Information may sit inside nested objects. A number may arrive as text after an update. The parser must still validate and normalize the structure.
This is why a common schema matters. The Elastic Common Schema defines shared field names and data types for events such as logs and metrics. Elastic notes that applications producing ECS-formatted logs can reuse the same ingest configuration. Structure helps, but agreement on the structure is what removes repeated parsing work.
Hand-written rules can serve a small, stable source well. Trouble begins when change becomes the normal state.
A small application update changes the order, name or type of a field. The old rule continues running but matches fewer events.
A new service or third-party tool begins emitting a format nobody added to the rulebook. Its logs arrive, but important fields remain trapped inside raw text.
Stack traces and exceptions may span many lines. A parser designed for one event per line can split one failure into several unrelated records.
This is the most dangerous case. The pipeline stays online and no obvious error appears. A field simply becomes empty or incorrect, weakening every search, dashboard and alert that depends on it.
Each exception creates another expression or source-specific configuration. Eventually, few engineers understand why the rules exist.
The human cost appears during incidents. In one DevOps discussion about regex and log parsing, engineers described refining searches while production was degraded and customer retention was on the line. This is not a calm pattern puzzle. The clock is running.
Automated log parsing reduces what a parser must know in advance. In 2017, researchers introduced Drain, an online method that used a fixed-depth tree to group messages and extract templates as logs arrived. The original IEEE paper on Drain helped establish pattern-based parsing as a serious engineering approach.
Instead of relying only on a library of hand-written patterns, the telemetry pipeline can examine incoming events, group messages with similar structures and separate stable tokens from changing values.
Consider these messages:
checkout failed user=1842 order=991
checkout failed user=2077 order=1034
checkout failed user=3391 order=1052
The values change, but the shape remains stable. A system can identify the repeated pattern and propose user_id and order_id as fields. It can also notice when a new version appears:
payment rejected account=1842 transaction=991 reason=timeout
Automation still needs visible failures, testing, versioning, raw-log preservation and rollback.
Engineers should not have to predict every possible message and hand-write every parser before the data becomes useful.
Grepr’s autonomous telemetry pipeline detects patterns and processes telemetry upstream, before it reaches the downstream observability or security platform. Teams get more consistent events without rebuilding their tools or maintaining an endless library of parsing rules.
Upstream parsing also affects cost. Teams gain more control over what they index and where they store it. They can keep raw data in lower-cost storage while sending structured telemetry to active analysis systems.
A strong log parser should make change visible and manageable. Look for:
Google Security Operations maintains a large list of supported default parsers, showing the scale of the problem. Prebuilt coverage is valuable. The next step is handling formats and changes no static list can predict.
Log parsing began as the work of teaching machines where each value sat inside a line. That work remains necessary, but the method is changing.
Collecting a log tells us that a system left a record. Parsing determines whether anyone can understand that record when it matters.
Log parsing turns a raw machine message into labelled fields. For example, it can separate a timestamp, error level, service name and user ID from one line of text. Once the fields are extracted, teams can search, filter, compare and analyse the event more easily.
Log parsing prepares the data by identifying and organizing its fields. Log analysis uses that prepared data to investigate failures, detect unusual activity, measure behaviour or understand what happened across a system. Parsing makes the evidence usable. Analysis asks questions of it.
Yes. JSON provides structure, but different applications may use different field names, nesting patterns, timestamps and severity values. JSON logs often still require validation, normalization and enrichment before they can be searched consistently across many services.
Regular expressions are widely used to extract fields from predictable text logs. They can work very well for stable formats. They become harder to maintain when a company has many sources or when message patterns change frequently. Dynamic detection can reduce the amount of manual rule writing required.
A failed parser may reject an event, leave it as raw text or extract the wrong value. Silent failures are particularly risky because the pipeline may appear healthy while alerts and searches operate on incomplete data. Good systems expose parsing failures and retain the original log for reprocessing.
Automated log parsing uses prebuilt formats, pattern detection or machine-assisted methods to recognize log structures and extract fields with less manual configuration. Reliable automation should still support testing, human review, version control, rollback and access to the untouched raw event.