Cross-service correlation
Connect related events across your entire stack, in the pipeline itself, before they reach your observability platform.


Go beyond simple transformations with real-time analytics legacy pipelines can’t handle.
.png)
Each event is processed independently, with no memory of what happened a moment ago or on another node. That design scales easily for simple filtering, but it creates architectural limitations on what the pipeline can do.
No matter how many rules you write, legacy pipelines can't:

.avif)
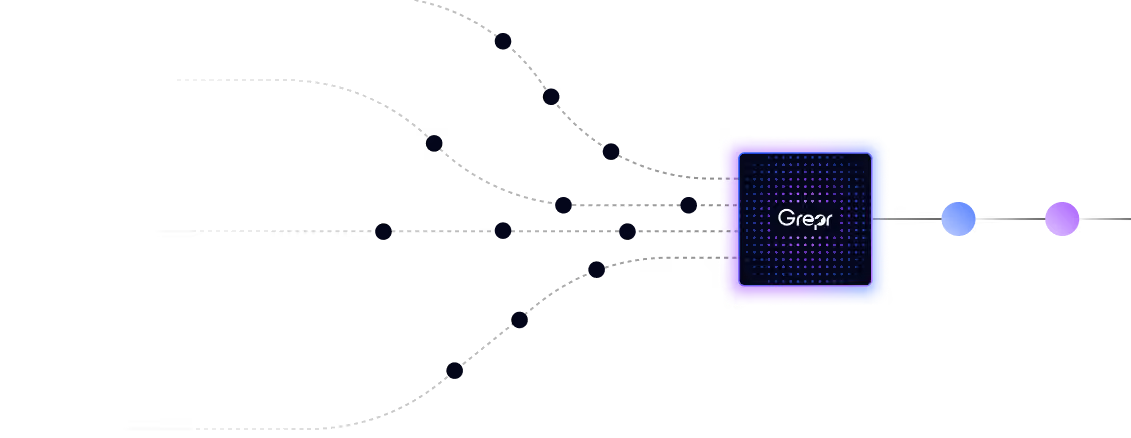
Grepr empowers you to analyze complete transactions across your entire stack in real time.

Telemetry management is the process of controlling how logs, metrics, traces, and events are collected, routed, filtered, stored, and sent to observability tools. Good telemetry management helps teams keep useful visibility while reducing noisy or repetitive data that drives unnecessary cost and operational work.
Telemetry management becomes difficult as teams add more services, releases, environments, and observability data sources. Manual rules, filters, and routing decisions can quickly become hard to maintain. Teams need enough data for reliability and incident response, but sending every low-signal event into premium observability tools can create high costs and noisy workflows.
Grepr automates telemetry management by identifying repetitive and low-signal telemetry patterns before they reach downstream observability platforms. Grepr forwards useful signal and summaries to the tools teams already use while preserving raw telemetry in lower-cost storage for incidents, investigations, and historical context.
A Grepr processing job is a unit of telemetry work. Jobs can run in streaming mode for live telemetry or batch mode for files, historical data, data lake queries, and backfills. Jobs can include operations such as reducers, filters, routes, sinks, and SQL transforms.
Batch testing lets teams validate processing behavior on files or historical data before applying the same logic to live telemetry streams. That helps teams reduce rollout risk when changing how telemetry is filtered, routed, summarized, or transformed.
No. Grepr should be positioned as reducing noisy downstream volume while preserving raw telemetry elsewhere. This gives teams a safer alternative to simply dropping logs, sampling aggressively, or shortening retention when observability costs rise.
Grepr’s query-aware capabilities can parse dashboards and alerts so important telemetry paths can be protected from reduction. Final public copy should list only confirmed integrations and supported query languages.
No. Grepr is designed to work with existing observability platforms. The goal is to reduce noisy telemetry before it becomes expensive ingest, indexing, or storage while keeping the observability workflows teams already rely on.
Manual telemetry pipeline rules require teams to decide in advance what should be routed, filtered, transformed, or dropped. Grepr’s pattern-detection approach is intended to identify repetitive telemetry as systems run, reducing the ongoing rule-maintenance burden.
Telemetry management is often shared across platform engineering, SRE, observability, DevOps, and FinOps teams. Engineering leaders care because telemetry affects reliability, cost, developer workflows, and incident response. Grepr’s page should speak to all of these stakeholders without making the message too generic.
The safest approach is to reduce low-value downstream telemetry volume without permanently losing raw context. That means preserving raw data, keeping existing observability tools in place, testing changes before live rollout, and giving teams access to fuller detail when incidents or investigations require it.
See how Grepr unlocks entirely new use cases for your team.


.avif)