

The intelligent operations layer for modern DevOps
Grepr sits between your telemetry sources and the observability tools you already use. With a one-line config change, Grepr reduces telemetry noise by 90% and gives you a full telemetry pipeline. Keep your dashboards, alerts, workflows, and data right where they are.









The Grepr Platform
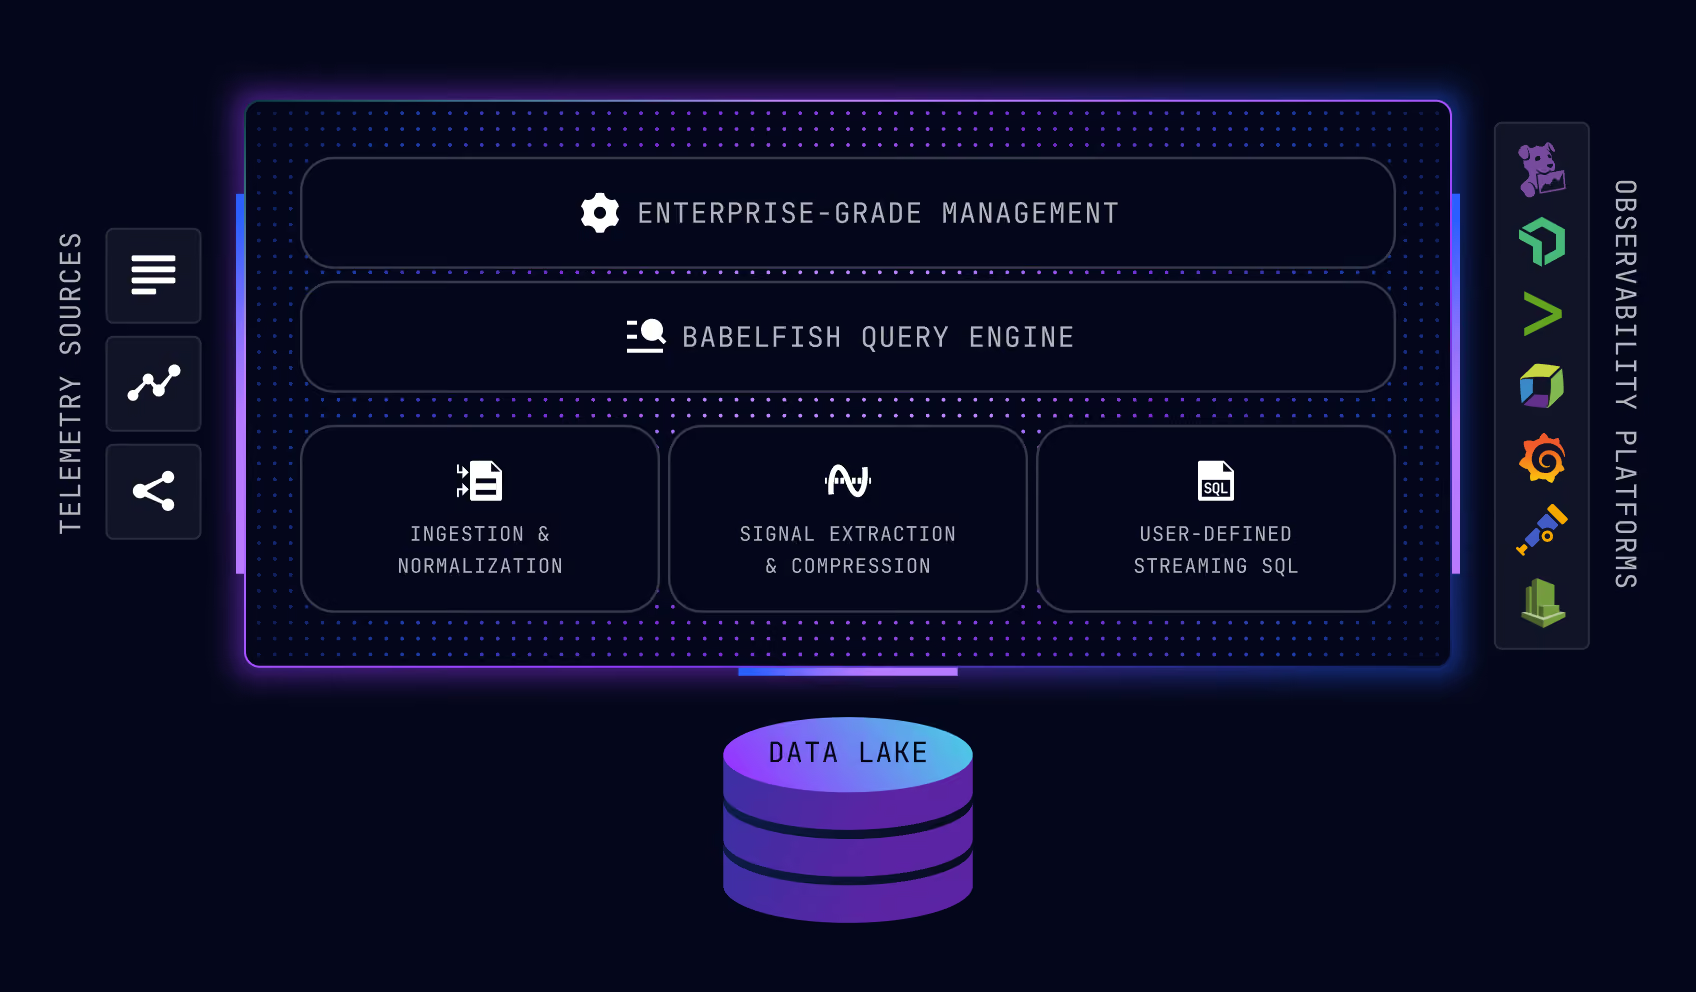
Grepr’s autonomous telemetry pipeline separates signal from noise, forwards compressed, low-noise data to your existing observability tools, and preserves raw data in low-cost storage for backfill and fine-granularity access when needed.
Grepr supports logs, traces, and metrics (Limited Preview), normalizing each observability vendor’s model into a format similar to OpenTelemetry in order to optimize for performance and usability.
Grepr’s polyglot ingestion layer proxies each supported vendor’s ingestion APIs, allowing you to point existing agents or collectors to Grepr without having to redeploy new ones.
Grepr lightly normalizes data but remains faithful to the semantics of the observability vendor’s model to preserve functionality.
Grepr’s stream processing engine runs massive local unsupervised machine learning and anomaly detection algorithms to classify signal from noise.
Grepr compresses the noise to maximize the signal in the data sent to your observability platform, often achieving more than 90% data compression.
Grepr’s stateful streaming SQL allows users to easily and flexibly transform data in flight.
Examples:
Create metrics out of passing data elements, create alerts, normalize, enrich or mask data, and create complex dynamic routing or classification decisions.
Create streaming SIEM rules on in-flight data and avoid sending it downstream.
Align your data with standards such as OCSF.
Remove PII and other sensitive data.
Grepr supports Datadog, New Relic, Splunk, Dynatrace, Grafana, OpenTelemetry, Cloudwatch, and other observability platforms.
Grepr’s data lake is implemented on top of S3, using your bucket, allowing you to retain control of your data. Data is stored using Apache Parquet and Apache Iceberg, giving you access outside of Grepr’s tools.
Grepr’s Babelfish query engine translates observability languages to streaming SQL or to queries on the Data Lake, so you can use your preferred language to query the data lake.
Grepr parses your existing dashboards and alerts to add passthrough exceptions in the pipeline and avoid impacting those dashboards and alerts. With this capability, you can safely roll Grepr out to production without a migration or rewrite.
Grepr’s RBAC enables auditing and isolation, so you can decide whether to centrally administer Grepr or to decentralize some aspects with centrally controlled guardrails.
Grepr’s Terraform provider enables upgrades using GitOps.
Use ‘Draft view’ and ‘Live view’ to test config changes before rolling out to production.
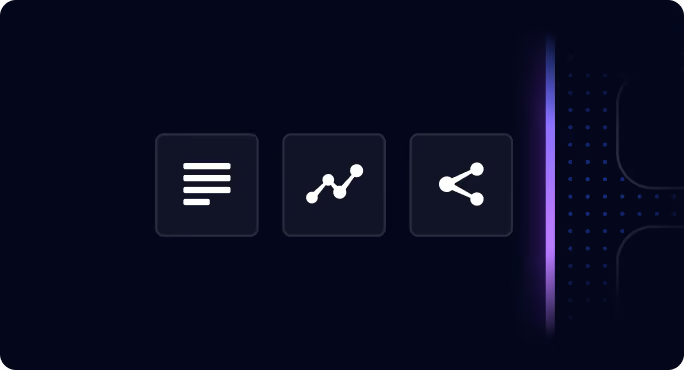
Grepr supports logs, traces, and metrics (Limited Preview), normalizing each observability vendor’s model into a format similar to OpenTelemetry in order to optimize for performance and usability.
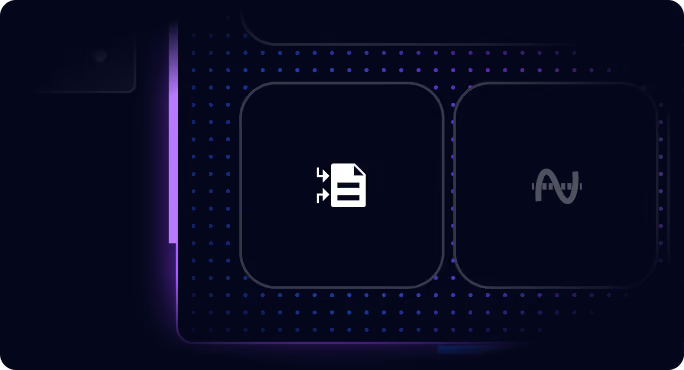
Grepr’s polyglot ingestion layer proxies each supported vendor’s ingestion APIs, allowing you to point existing agents or collectors to Grepr without having to redeploy new ones.
Grepr lightly normalizes data but remains faithful to the semantics of the observability vendor’s model to preserve functionality.
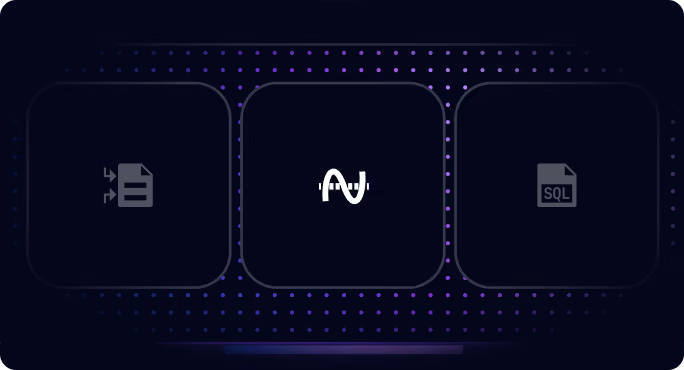
Grepr’s stream processing engine runs massive local unsupervised machine learning and anomaly detection algorithms to classify signal from noise.
Grepr compresses the noise to maximize the signal in the data sent to your observability platform, often achieving more than 90% data compression.
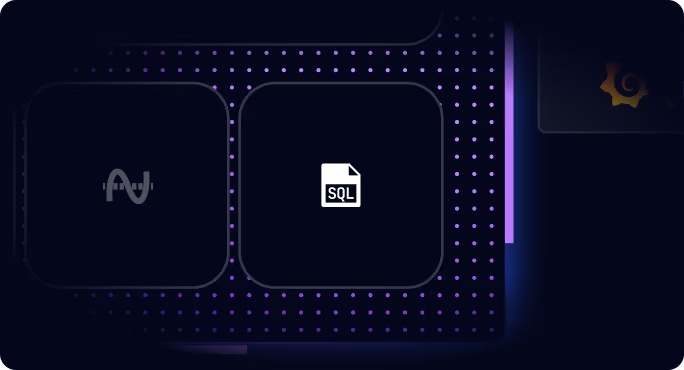
Grepr’s stateful streaming SQL allows users to easily and flexibly transform data in flight.
Examples:
Create metrics out of passing data elements, create alerts, normalize, enrich or mask data, and create complex dynamic routing or classification decisions.
Create streaming SIEM rules on in-flight data and avoid sending it downstream.
Align your data with standards such as OCSF
Remove PII and other sensitive data.
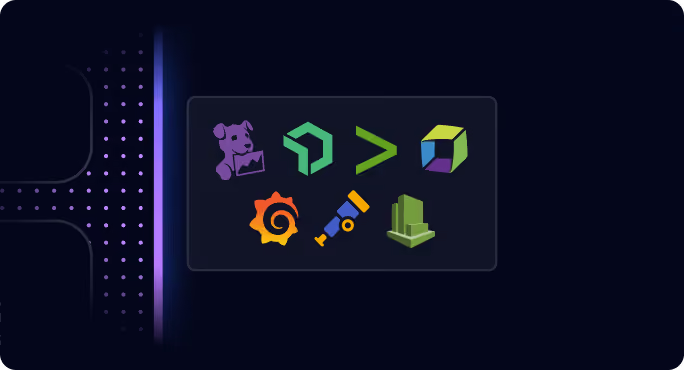
Grepr supports Datadog, New Relic, Splunk, Dynatrace, Grafana, OpenTelemetry, Cloudwatch, and other observability platforms.
Grepr’s data lake is implemented on top of S3, using your bucket, allowing you to retain control of your data. Data is stored using Apache Parquet and Apache Iceberg, giving you access outside of Grepr’s tools.
Grepr’s Babelfish query engine translates observability languages to streaming SQL or to queries on the Data Lake, so you can use your preferred language to query the data lake.
Grepr parses your existing dashboards and alerts to add passthrough exceptions in the pipeline and avoid impacting those dashboards and alerts. With this capability, you can safely roll Grepr out to production without a migration or rewrite.
Grepr’s RBAC enables auditing and isolation, so you can decide whether to centrally administer Grepr or to decentralize some aspects with centrally controlled guardrails. Grepr’s Terraform provider enables upgrades using GitOps.
Use ‘Draft view’ and ‘Live view’ to test config changes before rolling out to production.
Grepr maintains SOC2® compliance. Visit our trust center at https://trust.grepr.ai to learn more.
Support for most SSO providers, including Okta, to simplify user management and compliance.
Grepr runs as a multi-tenant SaaS service or in your AWS VPC with no external connections.

How Grepr reduces log noise
Grepr's large-scale clustering identifies patterns in real-time and tracks statistics about each. Grepr automatically passes through data for low-noise patterns such as errors or unique messages while compressing noisy heartbeats or the inadvertent debug message shipped to Prod. Compressed data is forwarded to your observability vendor, and raw messages are stored in queryable, low-cost storage.
Runs large-scale, real-time pattern mining across messages with hyper-optimized algorithms. New patterns are immediately detected, and Grepr combines messages of the same pattern.
Grepr passes through the first few messages of each pattern until that pattern hits the noise threshold. Then, subsequent messages are aggregated for a time window.
The cycle of sampling and summarizing repeats every time window, enabling Grepr to capture your data's changing dynamics.
How Grepr reduces traces noise
Grepr's path-based tail-sampling identifies unique execution paths in your application and samples by performance tier independently for each such path "signature." This fine granularity enables Grepr to massively reduce sampling rate, and thus APM costs, while ensuring full coverage of your application.
Buffers incoming spans and partitions them by trace ID, so every span belonging to a request is processed together and assembled into a complete end-to-end trace.
Traverses the full span hierarchy and serializes it into a structural signature, building a canonical record of the trace’s exact execution path. Loop collapsing keeps repeated operations from inflating that signature.
Groups traces by structural signature, a more granular split than the root span name, so every distinct path through your system is tracked on its own.
Compares each trace against others that took the same path, then samples by uniqueness and performance, keeping the rare paths and anomalies that coarse bucketing buries.
Selected traces are forwarded complete to the observability platform with zero missing spans. Every trace is preserved in low-cost storage for search and backfill when an investigation calls for deeper detail.
How Grepr Reduces Metrics Noise
Grepr's Path-based Tail-Sampling identifies every unique execution path in your application and samples by performance tier independently for each such path "signature." This fine granularity enables Grepr to massively reduce sampling rate, and thus APM costs, while still ensuring full coverage over your entire application.
Buffers incoming spans and partitions them by trace ID, so every span belonging to a request is processed together and assembled into a complete end-to-end trace.
Traverses the full span hierarchy and serializes it into a structural signature, a canonical record of the trace’s exact execution path. Loop collapsing keeps repeated operations from inflating that signature.
Groups traces by structural signature, a far finer split than the root span name, so every distinct path through your system is tracked on its own.
Compares each trace only against others that took the same path, then samples by uniqueness and performance, keeping the rare paths and anomalies that coarse bucketing buries.
Selected traces are forwarded complete to the observability platform with zero missing spans. Every trace is preserved in low-cost storage for search and backfill when an investigation calls for deeper detail.
Savings you can measure. Reliability you can trust.

“I don't hear about anything, which means nothing has changed, which is exactly what I wanted.”

How a Medical Technology Company Reduced Log Volume by 94% While Maintaining Reliability

“I've been through a lot of vendor evaluations, and this was the smoothest POC we've experienced.”

How a Global Retailer Stopped Paying to Index Noise

“We were skeptical that something could reduce our log volume that aggressively without us feeling it somewhere. The fact that our developers haven't noticed a change in how they work is the result we were hoping for.”


How CustomInk Cut Their CloudWatch Bill by 85% Without Impacting Dev or Ops

“After seeing what Grepr did to reduce our logs noise, extending it to traces was an easy call. We were seeing the same pattern: a lot of volume, most of it not particularly useful, and a Datadog billing model that scaled with every new host we spun up.”

How FOSSA Reduced Distributed Trace Volume by 90%

“Engineers didn't change how they work at all. Dashboards and alerts still worked as expected. We just stopped paying for 90% of our log volume that was never doing anything for us.”

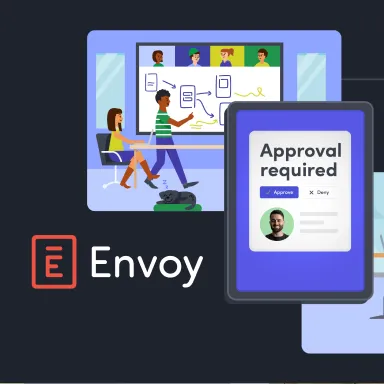
9 Days from Kickoff to Production: How Envoy Cut Log Volume by 90%

"Grepr helped us automate what to keep and what to skip, so we’re not paying to store or index noise. It lets us find the needle in the haystack without paying for the haystack!"


How Jitsu Cut Logging Costs by 90% While Managing Millions of Shipments Generating 400 Logs Each
"Since we deployed Grepr, we’re seeing a 95% reduction in log volume and didn’t have to change a thing in our app. I'd recommend Grepr to any team that's experiencing rising costs from an expensive logging platform!"
.webp)

Case Study: How FOSSA Reduced Their Logs by 95% Without Burdening Their Engineers
“I don't hear about anything, which means nothing has changed, which is exactly what I wanted.”
“I've been through a lot of vendor evaluations, and this was the smoothest POC we've experienced.”
“We were skeptical that something could reduce our log volume that aggressively without us feeling it somewhere. The fact that our developers haven't noticed a change in how they work is the result we were hoping for.”
“After seeing what Grepr did to reduce our logs noise, extending it to traces was an easy call. We were seeing the same pattern: a lot of volume, most of it not particularly useful, and a Datadog billing model that scaled with every new host we spun up.”
“Engineers didn't change how they work at all. Dashboards and alerts still worked as expected. We just stopped paying for 90% of our log volume that was never doing anything for us.”
"Grepr helped us automate what to keep and what to skip, so we’re not paying to store or index noise. It lets us find the needle in the haystack without paying for the haystack!"
"Since we deployed Grepr, we’re seeing a 95% reduction in log volume and didn’t have to change a thing in our app. I'd recommend Grepr to any team that's experiencing rising costs from an expensive logging platform!"
FAQ
Grepr is an Autonomous Telemetry Pipeline that eliminates noisy telemetry data, forwards high-signal data and summaries to your existing observability tools, and preserves raw telemetry in low-cost storage. This full-service telemetry pipeline includes a stateful streaming SQL engine that enriches data in ways other pipelines can’t.
A telemetry pipeline is the layer between your telemetry sources and the systems that consume the data. It collects logs, metrics, traces, and events, then processess that data to observability platforms, security tools, storage, and other destinations.
An autonomous telemetry pipeline performs much of that work automatically instead of relying on engineers to constantly write and maintain rules. Grepr uses machine learning in real time, reads dashboards and alerts to protect the data they depend on, and adapts as services and data patterns change.
Grepr reduces observability TCO by 75% by automatically sending noisy, low-value data to low-cost storage, only forwarding compressed signal and summaries of noisy telemetry to your existing observability tools.
Grepr’s signal processing engine detects millions of log patterns, trace signatures, and metric trends dynamically, instead of relying on static rules. No toilsome rule-building for engineering.
Grepr sends noisy, raw telemetry to low-cost storage under your control. That raw data can be manually or automatically backfilled, such as during an incident.
Grepr's query translation engine reads your existing dashboards and alerts and automatically ensures the data they depend on is routed through.
Grepr increases the signal-to-noise ratio within your observability tools, making it easier to troubleshoot when something breaks.
Grepr can be set up in 30 minutes. A single configuration change points your collectors to Grepr. No agents to install, no re-instrumentation, and no toilsome rule-building for engineering.
The terms are often used interchangeably, and the industry has not fully standardized the distinction. The clearest difference is scope. An observability pipeline collects, processes, and routes telemetry specifically for monitoring, troubleshooting, and reliability workflows. A telemetry pipeline is the broader category: it can route logs, metrics, traces, and events to observability platforms, SIEMs, data lakes, analytics systems, AI agents, or other destinations.
Ready to reduce your observability TCO by 75%?
Reduce telemetry noise in your observability tools. Instantly search or backfill raw data.