Product Features
Grepr support for traces is now GA



Following up on our limited release last year, we’re excited to announce the general availability of processing trace data in Grepr. GA reflects months of production use with enterprise customers, whose feedback shaped the capabilities that make this a complete, enterprise-ready offering.
A lot has changed since the limited release. Here is what is new for GA:
Most teams running microservices at scale already know that trace data grows faster than log data. Datadog’s own analysis across its customer base found that unsampled trace volumes are roughly five times larger than log volumes.
The standard response is to sample aggressively at the collector, which reduces what reaches your observability platform, but it also means the majority of traces are gone before anyone decides they need them.
Adding traces to Grepr takes a single configuration change in the collector you already run, the same way you sent logs to Grepr. Once that change is live, three things happen:
Sampling exists because trace ingestion and indexing are expensive, so most teams reach for one of two standard techniques:
Both techniques force a trade-off between cost and ensuring that the exact trace you need survives.
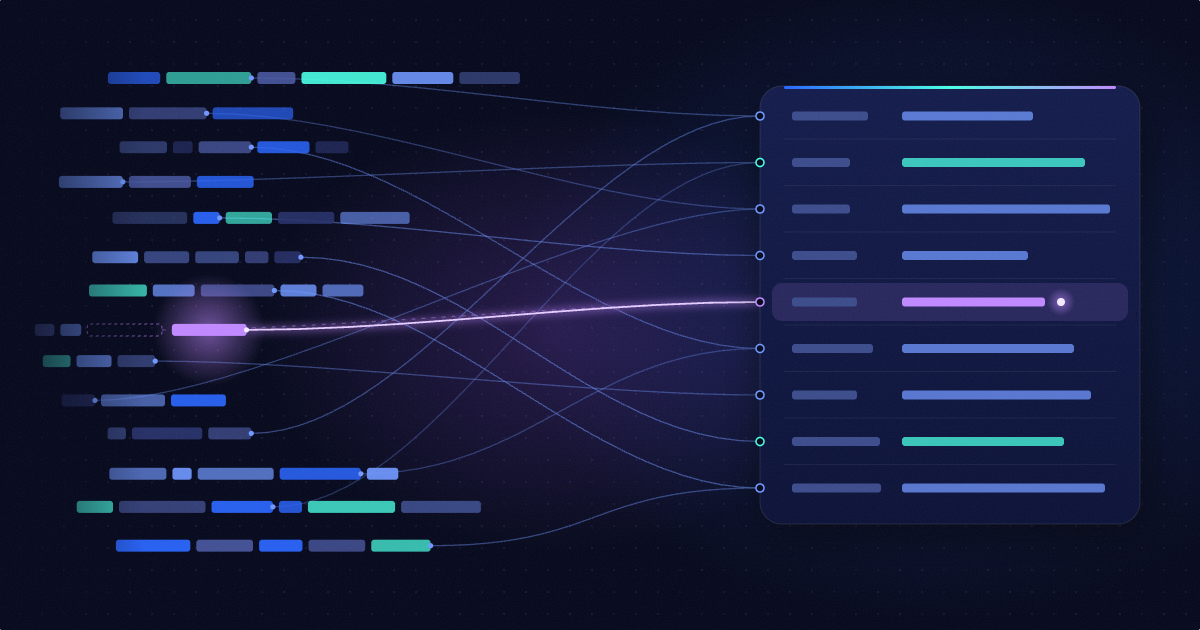
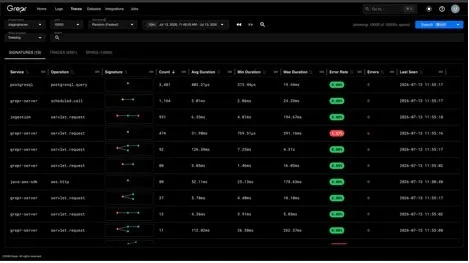
Grepr identifies the most interesting and slowest traces for every signature, and runs critical path analysis and other checks on them, so you get complete coverage of each path through your system instead of a random slice of your traffic. Those interesting traces are sent to your observability platform while the low-value traces are sent to low-cost storage.
Under the hood, path-based tail sampling runs as a multi-stage process that turns millions of spans into a representative, full-fidelity set of traces:
Grepr eliminates the tradeoff between having enough trace data and spending too much on observability. Because Grepr sends only the traces worth indexing to your observability platform (and raw traces to low-cost storage), you spend significantly less. During an incident, you can always backfill specific traces within seconds into your observability platform and investigate with your existing workflows, dashboards, and service maps.
So you can stop sampling at your collectors and dropping traces before anyone knows if they matter or not.
As FOSSA’s microservices architecture scaled, distributed trace volume grew with it, and Datadog’s host-based APM billing became hard to predict as clusters scaled during peak loads. FOSSA needed to keep all of their traces, since they could not know in advance which ones would matter, and per-service sampling was error-prone and tedious. Engineers ended up spending time on cost reviews and quota discussions instead of building product.
FOSSA had already seen what Grepr’s signal processing engine did for logs, so in less than an hour, they set up a pipeline for traces and pointed their collectors to Grepr. Their goal was the same as with logs: dramatically reduce what reaches Datadog while ensuring nothing operationally important gets lost. Grepr filters out redundant, low-value traces and sends high-value signals to Datadog, unmodified, prioritizing errors and high-latency outliers.
FOSSA reduced distributed trace spans by 90% without losing important trace data or impacting operations. Because Datadog was billing them for APM overages, that reduction took their overage charges to zero, with no changes to how engineers instrument code or troubleshoot incidents. Dashboards kept populating, alerts kept firing, and any specific trace remained available in S3.
As Dave Bortz, VP Engineering at FOSSA, put it, “We wanted the same outcome we got with logs, and we got it. Fast implementation, no code changes, no dashboard rebuilds, no workflow disruptions. Our engineers kept working exactly the way they always had, and the costs came down.”
If you already run a Grepr pipeline for logs, adding traces is a single configuration change. If you are new to Grepr, the steps are the same: you create a pipeline and point your collector at it.
Here is the full walkthrough:
1. Create an OpenTelemetry or Datadog source in your existing Grepr pipeline.
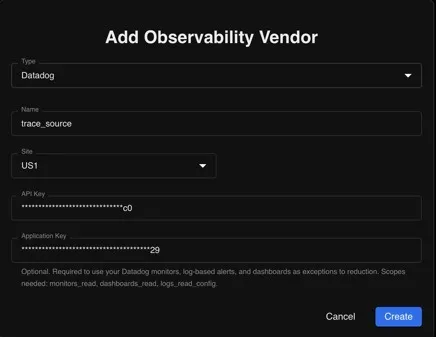
2. Point your agent at the Grepr ingestion endpoint.
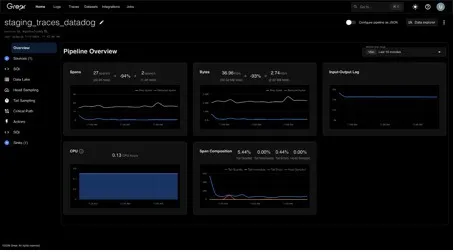
3. Confirm spans are arriving in Grepr and that path-based tail sampling is forwarding traces to your observability platform.
4. Verify full trace data is landing in your data lake, queryable with your existing syntax.
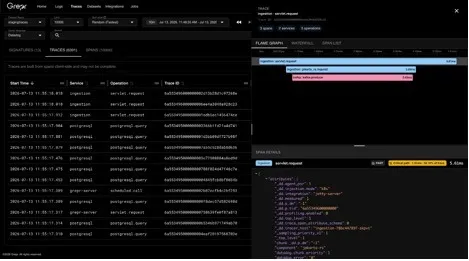
Your existing log pipelines keep running exactly as before. Traces and logs are separate signals, each flowing through its own pipeline, and both land in the same Grepr data lake.
How does Grepr reduce trace volume without losing the traces I need? Grepr uses path-based tail sampling. It identifies every unique execution path in your application and samples each path independently, keeping the most interesting and slowest traces for every path. Out of thousands of traces, usually less than a hundred represent distinct paths, so you get complete coverage of your system instead of a random slice of your traffic.
What is path-based tail sampling? It is a multi-stage process that turns millions of spans into a representative, full-fidelity set of traces. Grepr assembles complete traces by trace ID, maps each one to a structural signature of its exact execution path, buckets traces by that signature, analyzes each trace against others that took the same path, and routes the selected traces to your observability platform.
Do I need to change my instrumentation or collector? No. You continue to use your existing agents or collectors with a simple configuration change to use the Grepr ingestion endpoint.
Where does my full trace data go? Grepr writes the complete, unmodified trace data to your data lake, so nothing is permanently lost. During an incident, you backfill the specific traces you need into your observability platform and investigate with your existing workflows.
How much can I save? FOSSA cut distributed trace volume by 90% and saw Datadog APM costs drop sharply, with no changes to how engineers instrument code or troubleshoot incidents. Your results will depend on your traffic patterns and current sampling setup.
Does it work with my observability platform? Yes. Grepr forwards the selected traces to your existing platform and preserves the full dataset in low-cost storage, so your day-to-day workflows, dashboards, and service maps stay intact.