Grepr reduces companies’ observability costs without disrupting engineers’ existing workflows. One way Grepr achieves this cost reduction is by minimizing the number of logs sent to vendors using summarization and intelligent sampling (https://www.grepr.ai/blog/reducing-logging-costs-part-1). However, when working with Application Performance Monitoring (APM) tools that provide full execution traces for requests, engineers expect comprehensive logs associated with those traces. Additionally, users may need trace-like data outside the scope of APM. For example, they might want to see all logs related to a request hitting each endpoint or all logs associated with a Spark job or SQL session. So, how does Grepr balance the need for log reduction with the requirement of providing complete logs for traces?
We heard from users that accessing full logs for at least a subset of traces in the vendor tool is important, without having to backfill logs or search in the Grepr Data Lake. The problem is that random log sampling can lead to incomplete trace log sets. Therefore, we need to ensure that a portion of traces have their full set of associated logs passed through to the vendor tool without aggregation.
For the rest of this blog, “trace ID” refers not only to IDs inserted into log messages by APM tools but also to any identifier like a Spark job ID, user ID, or request ID that users consider a “trace” for which they require complete logs.
Feature Overview
To enable users to have a full set of logs for a sample of traces, Grepr needs to:
- Find the trace ID in the message
- Sample unique trace IDs using a sampling ratio specified by the user. 100% means all logs with trace IDs are kept, while 10% means that 1 out of 10 traces will have full logs.
- For the selected trace IDs, forward all logs with those trace IDs to the vendor.
To find trace IDs in the message, users can specify the path to a tag or attribute that contains the IDs, and Grepr checks that path for a value in every incoming message. If the trace ID is not already present as a field in a structured log message, users can write Grok rules to extract it. Users can also specify a query predicate to filter logs considered for sampling, enabling them, for instance, to only sample traces from specific services or applications.
Sampling Trace IDs
How do we select trace IDs and make sure all messages with that trace ID are passed through without aggregation? To do this, we’ll need to identify the first message for each trace ID. Consider the following:
- Grepr is a distributed system: Messages with different trace IDs may be processed by different nodes.
- We need to know if a trace ID is new at scale: Upon encountering a new trace ID, we can determine that the message is the first in that trace, enabling us to apply sampling. However, tracking previously seen trace IDs without excessive memory consumption in a streaming system is not easy.
Problem 1: Distributed processing of trace IDs
How do we ensure that all messages belonging to the same trace are processed by the same node in a distributed system? This is efficiently resolved using Apache Flink, our underlying stream processing engine. We filter messages matching our criteria and containing trace IDs and we partition them by the trace ID. Consequently, all messages belonging to the same trace are processed by the same node.
Problem 2: Tracking trace IDs
How do we prevent memory exhaustion while tracking previously seen and active trace IDs for sampling decisions? Extended trace durations (e.g., for asynchronous jobs) require maintaining a large number of trace IDs for longer periods. When there could be thousands of trace IDs per second per individual node, this could mean millions of traces in memory along with their associated state.
Using Hash Sets
One approach involves a hash set per trace ID to track “seen” trace IDs. Upon encountering a trace ID, we check its presence in the seen set. If absent, it’s new. We then probabilistically decide whether to sample the trace ID and subsequent messages with that ID. The trace ID is then added to an “active” set, ensuring future messages with that ID are passed through. This allows us to track each trace ID and its state (active or seen).
Each seen or active trace ID would have an associated timer for expiration. On expiration, the ID is removed from each set.
However, this approach is resource-intensive, involving the overhead of hash sets and timers per trace ID. Is there a more efficient method?
Using Bloom Filters
While a set lets us quickly determine whether a trace ID has been seen, they consume significant memory. Employing a Bloom filter drastically reduces memory usage at the cost of a small (configurable) probability of false positives. A Bloom filter definitively indicates if an element is not the existing data set, but may falsely report an element as present.
The memory savings are significant: a set of 100,000 UUIDs (16 bytes each), uses around 2.8MB, whereas a bloom filter for 100,000 elements at a 1% false positive rate uses only 120KB (~ 95% reduction).
However, two challenges arise with Bloom filters: 1) they do not support removals, and 2) the timer for each trace ID can still be significant.


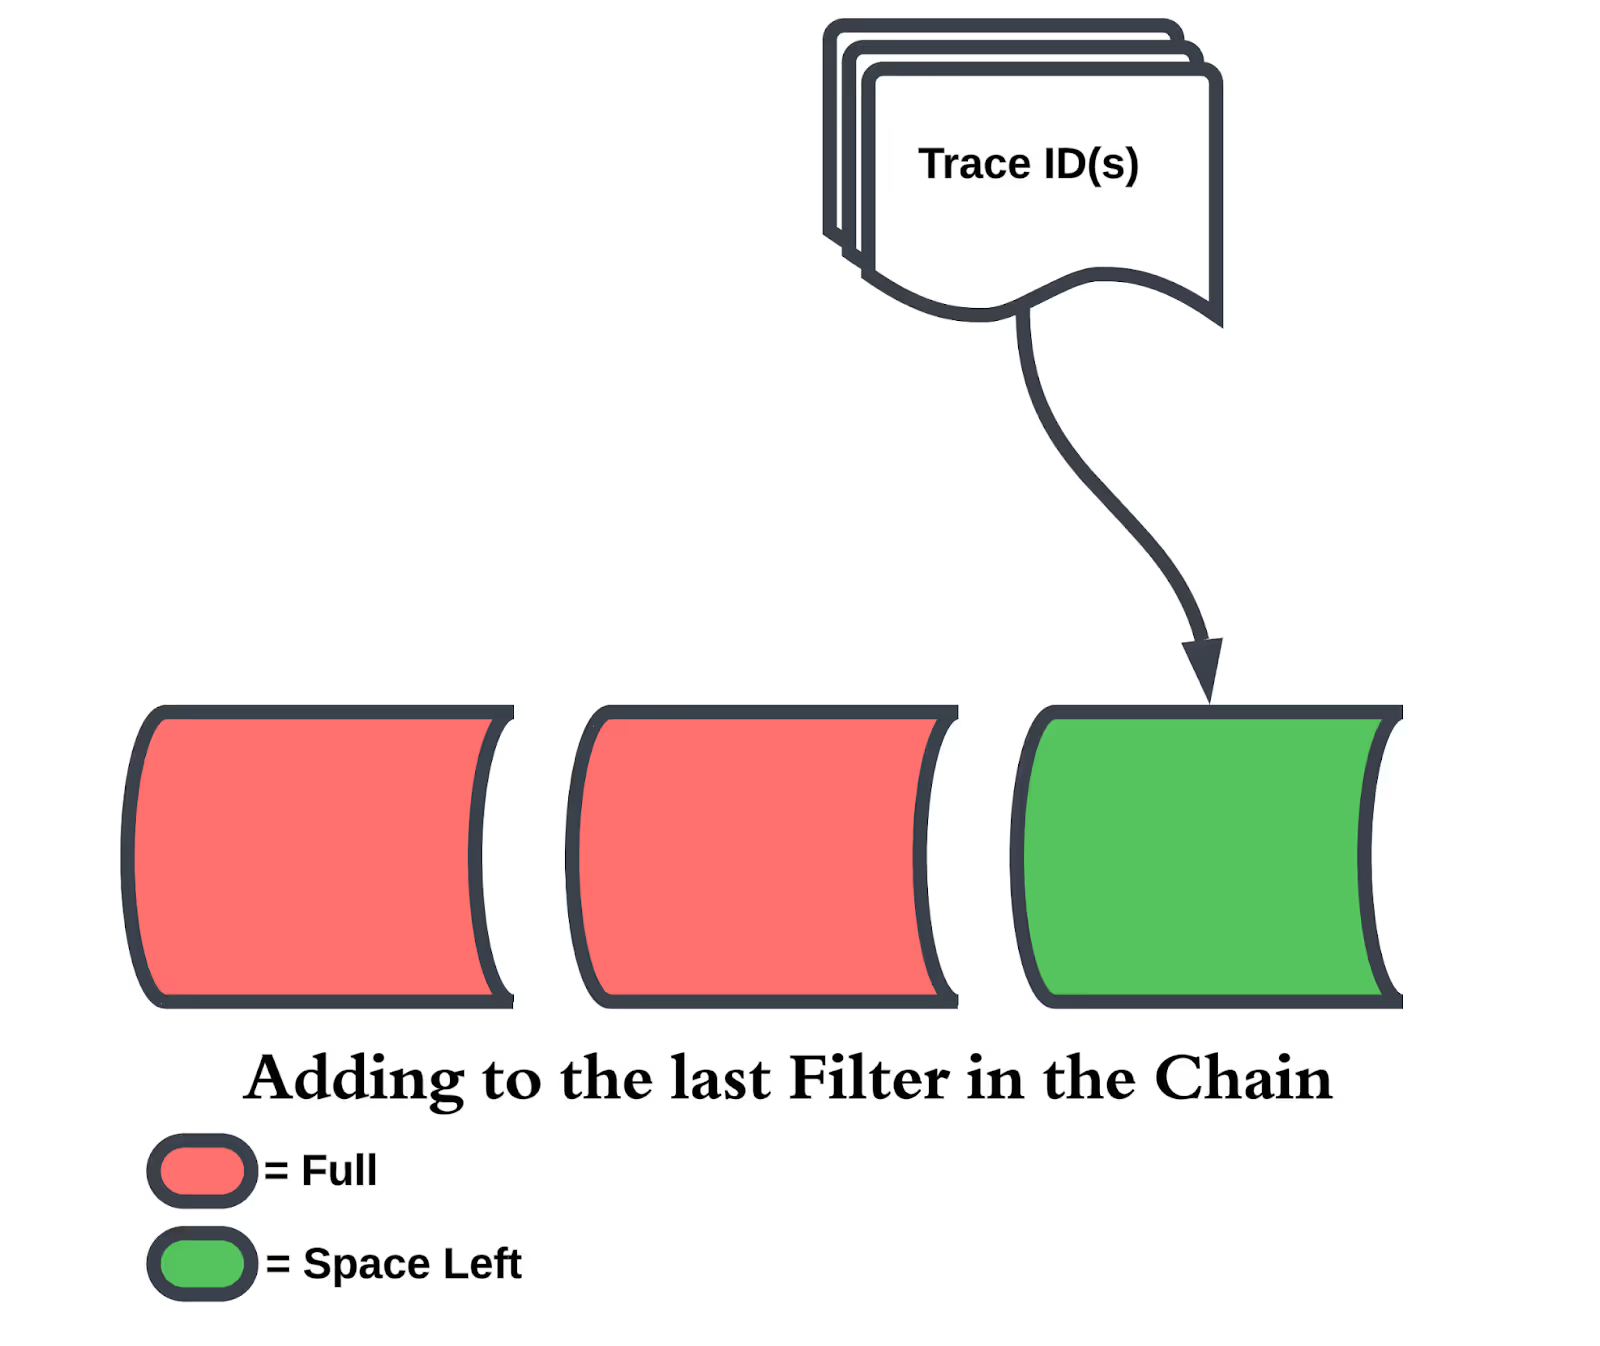
To address these challenges, we utilized multiple Bloom filters in a circular buffer. The filter at the head of the buffer is the “active” filter into which we add new trace IDs. Existence checks involve the entire set of Bloom filters. As time progresses, every time window, we shift the filters so that the oldest filter is cleared, becoming the newest “active” filter. This creates a “forgetful” Bloom filter, resolving both challenges simultaneously.
Conclusion
Possible future enhancements include dynamically adjusting filter size based on incoming message rates or lowering the false positive rate in later filters for greater efficiency. This capability is already live in Grepr’s production release. Interested in trying it out? Sign up for a free trial at grepr.ai!
More blog posts
All blog posts
Grepr at Observability Summit 2026

Structured Logging Best Practices for Modern Apps in 2026
.gif)


