Product Features
Introducing Agent Sessions: See how your org actually uses AI coding agents (Preview)


Claude Code. Codex. OpenCode. Engineering orgs have adopted AI coding agents faster than almost any tool category before them. And just as fast, they've lost observability into what those agents are actually doing.
Today we're opening up early access to Agent Sessions, a new capability in Grepr that gives you observability into your AI coding agents (coming soon: any LLM harness or framework that emits OpenTelemetry data): it captures, normalizes, and makes queryable every session your AI coding agents run, so you can search them, audit them, and analyze them in aggregate, the same way you'd already expect to for logs or traces.
Every one of your AI coding agents runs as its own session, emitting its own mix of traces, logs, and events with no shared format and no central home. If you're leading an engineering team, you can't easily answer basic questions like:
This blog walks you through how Agent Sessions answers each of those directly.
Agent Sessions is a new pipeline type in Grepr, alongside log and trace pipelines. Coding-agent and LLM harnesses emit traces, logs, and events together, and Agent Sessions captures all three, normalizes them into a consistent session record, and lands them in a queryable dataset in your Grepr data lake.
Getting your data in is simple (see our Docs): point your agents' OpenTelemetry output at a Grepr endpoint (see our docs for a quick setup), and every session lands in Grepr, ready to search and analyze. That data lands in your own S3 buckets rather than a shared store, so privacy and data residency are handled by design.
Once it's running, you can:
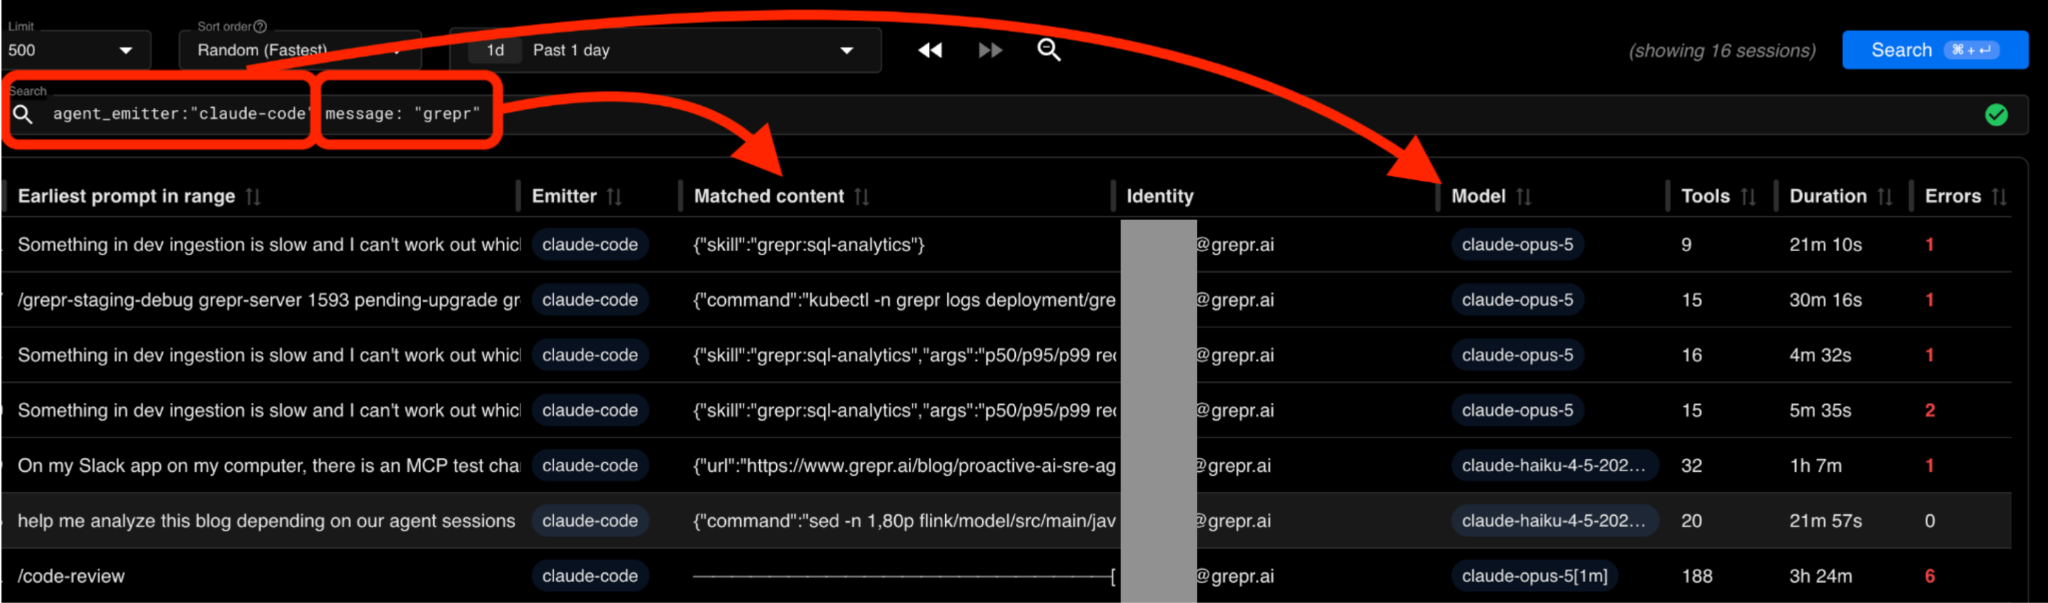
Search and filter every session across your org, the first answer to "what is my team actually using these agents for?" Full-text search across prompts, filter by which harness produced a session (Claude Code, Codex, OpenCode), by identity, or by model, down to a single matched keyword inside a single prompt, or as broad as "everything from the last day."
Drill into any individual session to see which ones are failing, and why. Open a session and see the full transcript: every turn, every tool call, every error, active duration, and total tool calls. You can see exactly where an agent hit an MCP error or a failed shell command, which is often the fastest way to figure out why an agent underperformed: a missing permission, a misconfigured integration, a bad access scope.
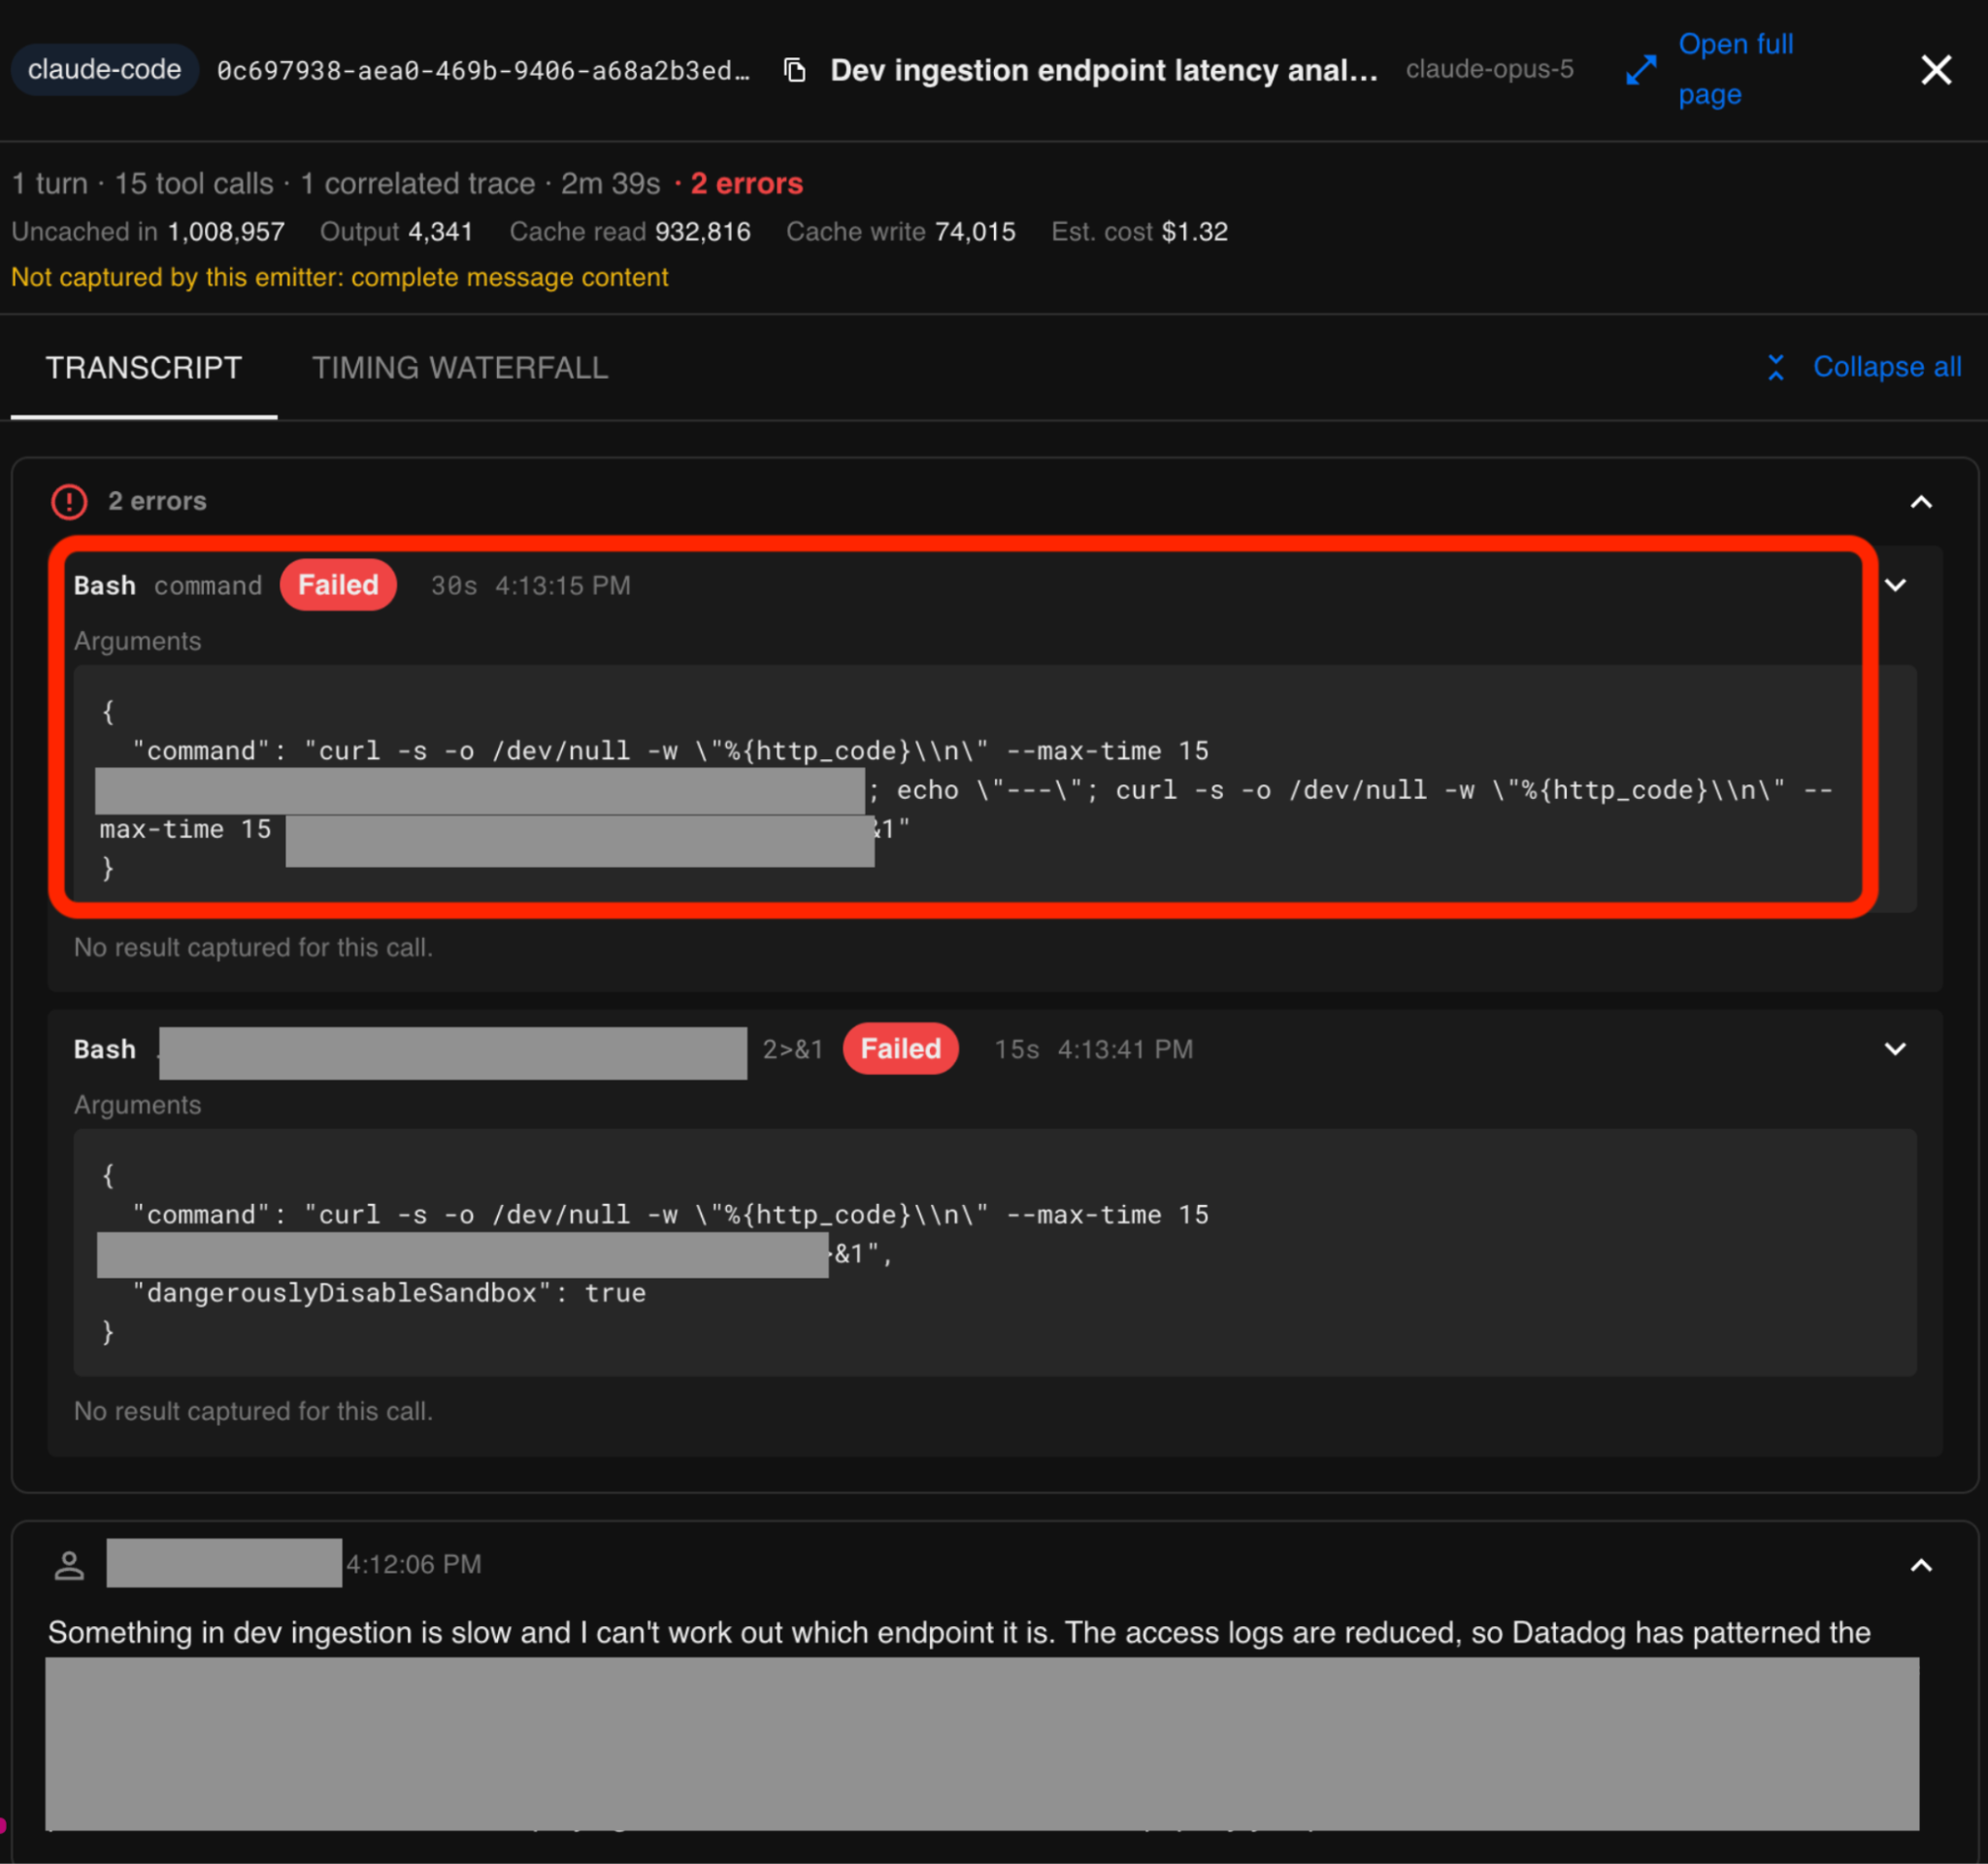
Understand token costs. Grepr surfaces the token usage and estimated cost each session reports, when the harness provides it (uncached input, output, cache read, cache write), directly from the agent tool itself.
Run aggregate analytics across large volumes of sessions at once, including where the repetitive work is. This is where Agent Sessions goes beyond a searchable log. Point the analyzer at a set of sessions and it uses an embedding model to cluster them by intent, automatically grouping sessions into categories like "code review assistance" or "code verification and execution." Seeing which intents dominate is often the fastest way to spot repetitive work worth automating. The resulting report shows you the following (and more), all in one dashboard, downloadable as CSV:
Intent clustering and the token/tool breakdowns above are analytics built into Grepr out of the box, but the underlying session data is also queryable directly with SQL, so if you want a custom report or a metric we haven't built a dashboard for yet, you can write your own query against it.
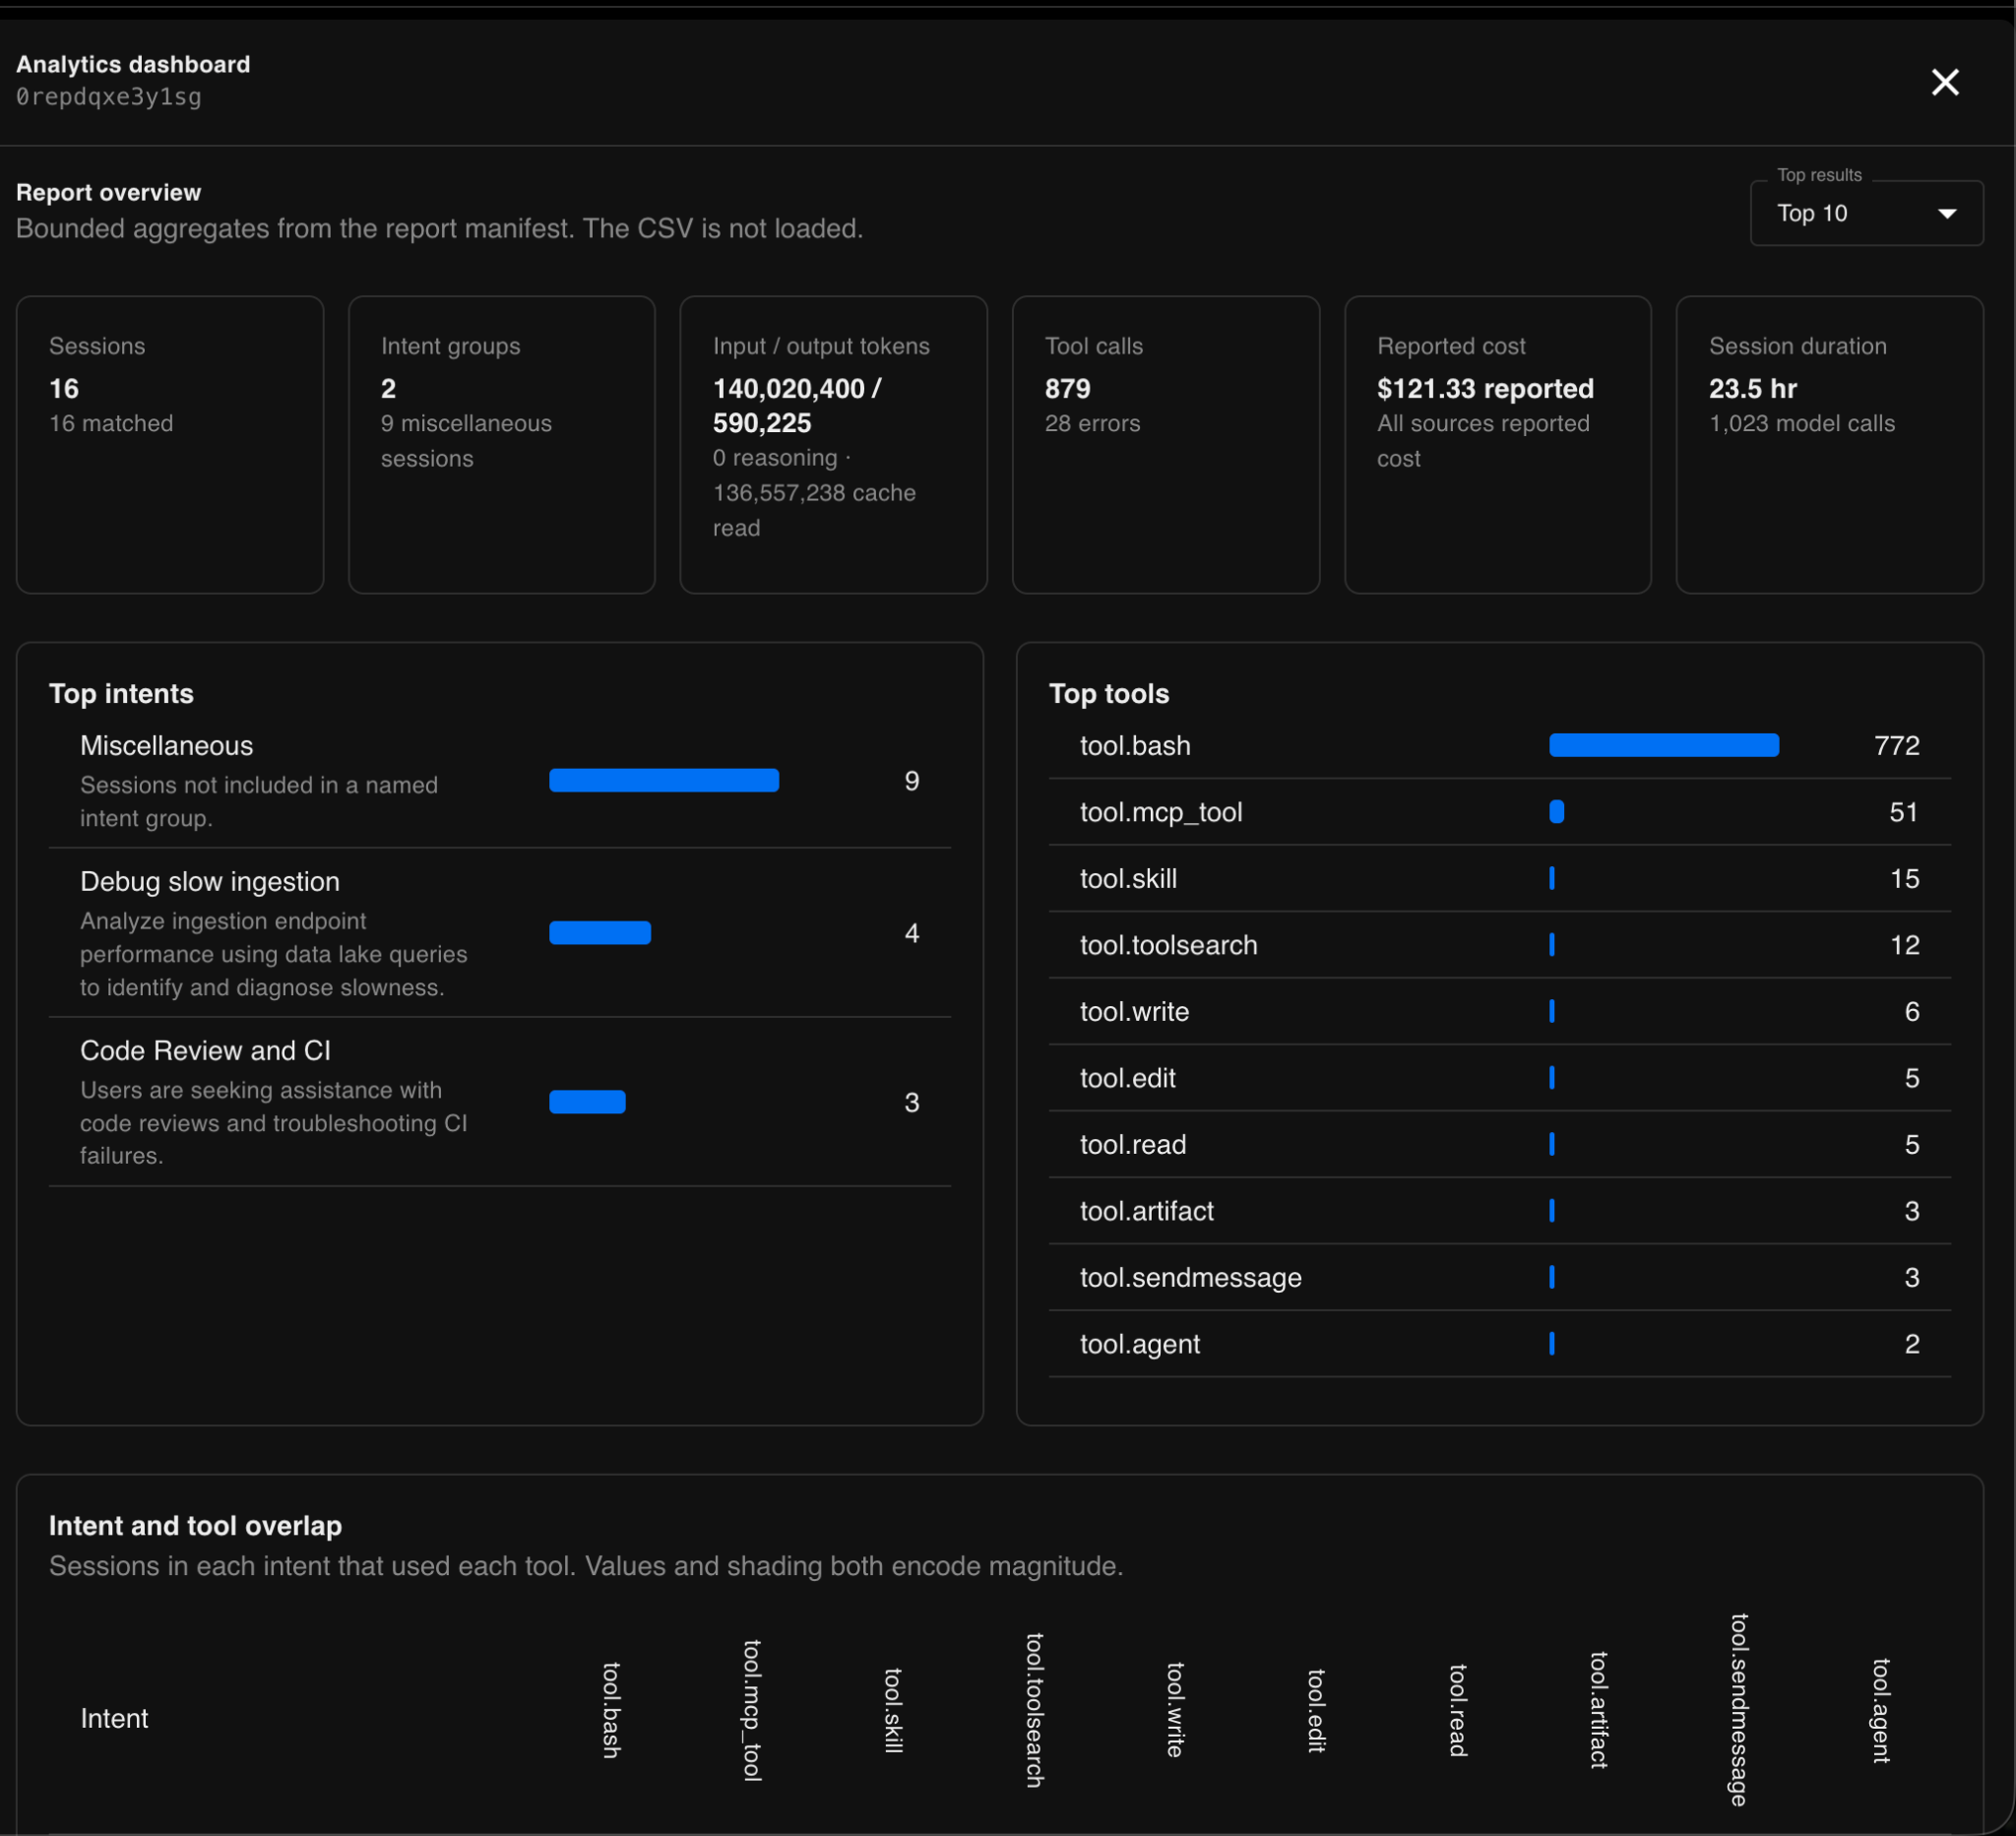
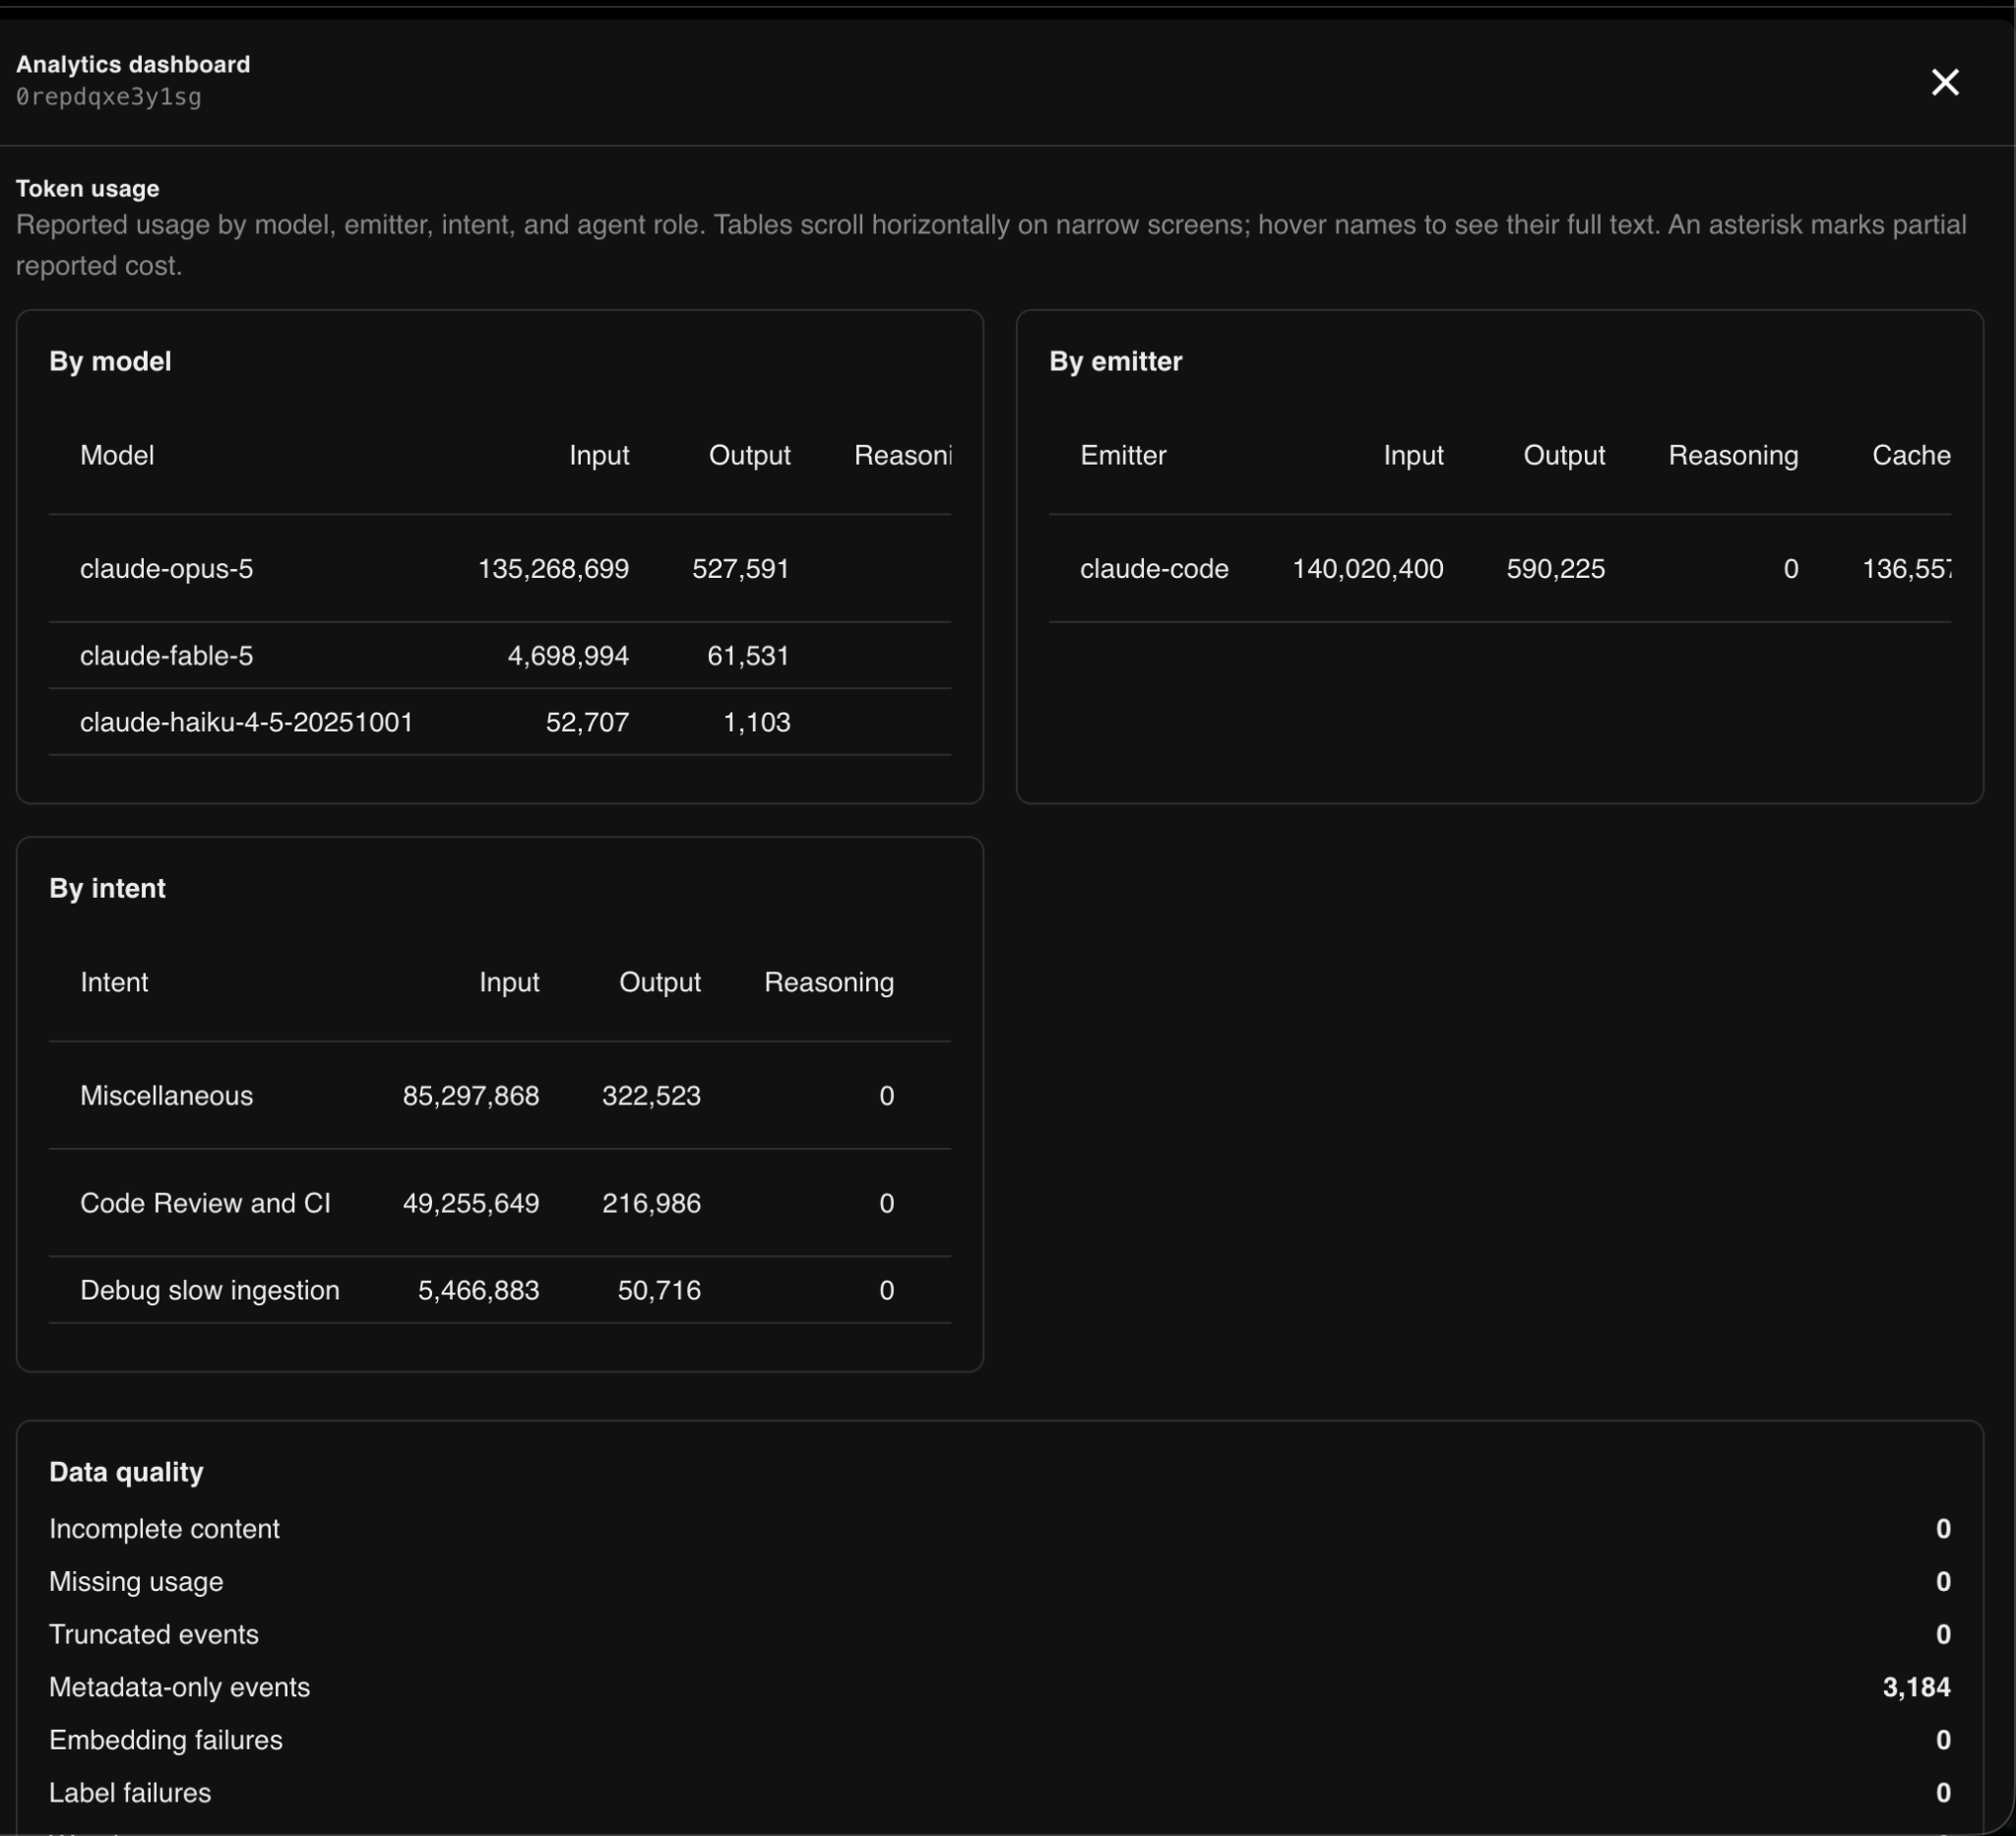
Send the same data to the tools you already use. Agent Sessions doesn't have to be the only place this data lives. If you're already routing traces and logs elsewhere, you can sync some or all of your agent session data to any OTLP-compatible destination too. And we're extending Agent Sessions beyond coding agents into other LLM frameworks and harnesses.
Agent Sessions is in Preview. If you'd like to try it out, reach out to us so we can enable it in your account.
Agent Sessions is a new pipeline type in Grepr, alongside log, trace, and AI pipelines, that gives you observability into your AI coding agents and LLM frameworks and harnesses. It captures the traces, logs, and events each session emits, normalizes them into one consistent session record, and lands them in a queryable dataset in your Grepr data lake.
Agent Sessions works with Claude Code, Codex, OpenCode, and LLM frameworks and harnesses that emit OpenTelemetry output. You can filter sessions by which harness produced them, as well as by identity or model.
Point your agents' OpenTelemetry output at a Grepr endpoint, and every session lands in Grepr ready to search and analyze. Setup instructions are in the Docs, and the data lands in your own S3 buckets, so privacy and data residency are handled by design.
It answers the ones engineering leaders usually cannot: what your team is really using AI agents for, where token spend is going, which sessions are failing and why, and what repetitive work you could automate instead of paying an agent to redo it every time.
Yes. Open any session to see the full transcript, every turn, tool call, and error, plus active duration and total tool calls. You can pinpoint exactly where an agent hit an MCP error or a failed shell command, which usually traces back to a missing permission, a misconfigured integration, or a bad access scope.
Yes. Grepr surfaces the token usage and estimated cost each session reports when the harness provides it, broken out by uncached input, output, cache read, and cache write, straight from the agent tool itself.
Yes. The analyzer uses an embedding model to cluster sessions by intent, grouping them into categories like "code review assistance" or "code verification and execution," and reports total sessions, token usage by model and harness, most-used tools, and where errors concentrate. The underlying data is also queryable with SQL for custom reports.
No. If you already route traces and logs elsewhere, you can sync some or all of your agent session data to any OTLP-compatible destination.
.png)