Engineering Guides
What Is a Telemetry Pipeline? How It Works, Architecture and Business ROI


At an airport, you hand your suitcase to the airline at the check-in counter. Airports spend a great deal of time telling people to keep bags close, then ask you to hand yours to a stranger. Travel contains several small acts of faith. This is one of them.
A label is attached to the suitcase. Then the bag disappears behind a rubber curtain. You trust the label. The suitcase receives very little say in the matter.
The label turns an ordinary black suitcase into one specific bag. It carries the passenger name, flight, destination and time. Scanners read it at different points. Sorting systems use the information to send the bag in the right direction. A changed flight creates a changed route.
Now imagine your suitcase fails to arrive.
An airport employee searches for its baggage number. The check-in team has one record. Security has another. The aircraft loading team has a third. Each record confirms one part of the journey, yet nobody can see the whole journey on one screen.
The employee searches three systems and compares their times. The suitcase created plenty of information. The airport stored each piece separately, so finding the point where the journey ended takes far longer than it should.
Modern software faces the same problem. Applications create millions of records. Those records become valuable when they help someone understand what happened, where it happened and what should happen next.
A telemetry pipeline performs that work. It collects information from applications and infrastructure, adds context, processes each record and sends it to the systems that need it. The result is a connected journey from an event to an explanation.
Consider a customer buying a pair of shoes online. She chooses a size, enters her card details and presses Pay. The screen spins for several seconds. Her bank approves the payment. The website shows an error. The order page remains empty.
Behind that one screen, several systems took part. The website received the click. A fraud service checked the transaction. The payment service contacted the bank. The order service waited for confirmation. The database prepared to create the order.
Each system leaves behind a different kind of evidence.
All four signals describe the same checkout from different angles. Metrics show the size of the problem. Logs show individual events. Traces show the path of a request. Events show changes that may explain the timing.
Telemetry is the evidence a system leaves behind while it runs. A telemetry pipeline prepares and connects that evidence so engineers can rebuild the customer journey.
The technical investigation begins here. The business impact began several minutes earlier. Every customer reaching the same broken step may leave before completing an order. Support teams receive payment complaints. Finance teams reconcile approved payments with missing orders. Engineers pause planned work and begin searching for the failure.
This is why telemetry matters beyond infrastructure health. A payment timeout can affect conversion, customer trust, support volume and revenue at the same time. A telemetry pipeline helps teams measure that impact while the problem is still small enough to contain.
Collection feels like safety. If a system records everything, the answer appears to be waiting somewhere inside the data. The word somewhere carries a great deal of responsibility.
Imagine that the checkout produces records across five services. One service calls the customer field user_id. Another uses customerId. The payment gateway stores a transaction number. The order service creates an order number several seconds later.
An engineer now has several pieces of the same story with several names. The data exists. The connection remains hidden.
Volume makes this harder. Healthy requests generate repetitive messages every second. Containers appear and disappear. Developers add new fields. AI applications can produce long traces for prompts, model calls, tools and responses. A single high-cardinality attribute can create thousands of metric series.
High cardinality means a field has many possible values. A region field may contain ten values. A customer ID field may contain ten million. Grouping every metric by customer ID creates a huge number of combinations, which raises storage and query costs.
A company can collect more telemetry while useful signal becomes harder to find. Good telemetry management gives each record context, purpose and a suitable destination.
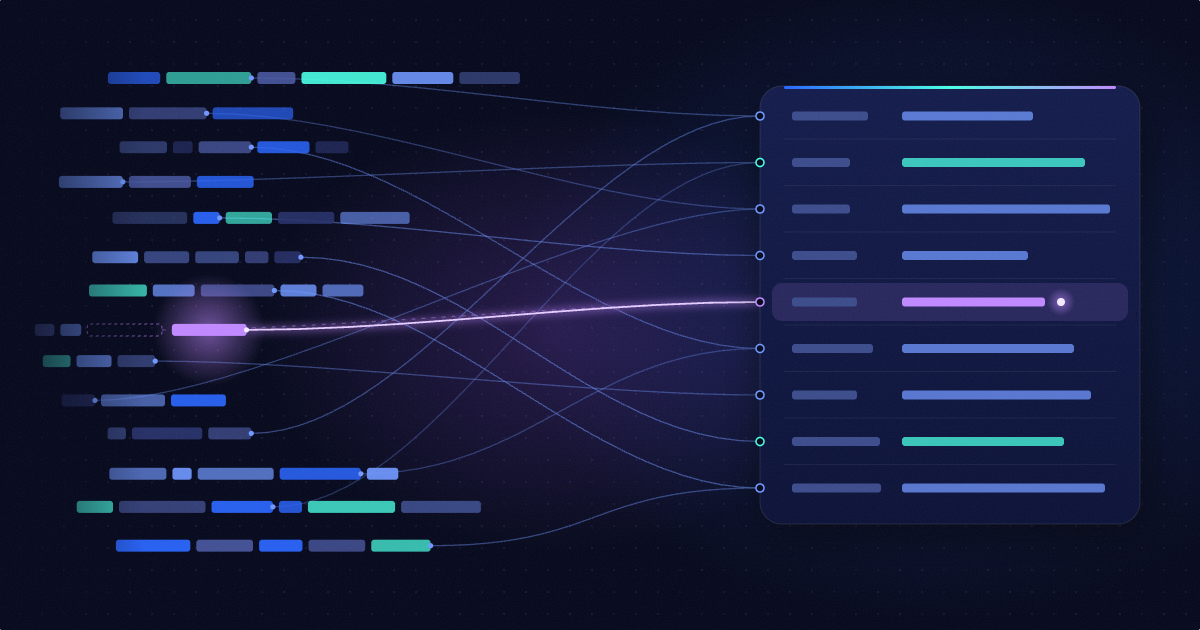
A telemetry pipeline sits between the systems producing telemetry and the platforms that analyse or store it. The telemetry pipeline receives logs, metrics, traces and events while they are moving.
For the failed checkout, the telemetry pipeline may attach the same region, service, deployment version and trace ID to records from several systems. It may standardise user_id and customerId into one field. It may connect the bank transaction with the request trace. It may summarise repeated health checks and preserve the failed payment in full detail.
By the time the records reach an observability platform, the engineer can search once and follow the journey. The customer clicked Pay. The fraud check passed. The bank approved the payment. The payment service timed out before receiving the reply. The checkout ended before the order service created the order.
The telemetry pipeline turns scattered records into a usable account of events. This is the central purpose of telemetry pipeline architecture.
A telemetry pipeline works through three main stages. Each stage answers a practical question.
Collection answers where the information comes from. Applications, servers, containers, databases, cloud platforms and network devices produce telemetry in different formats. Agents, software development kits and collectors receive those signals.
OpenTelemetry provides a shared standard for generating and collecting logs, metrics and traces. An OpenTelemetry pipeline gives teams a common way to instrument services and send data to different backends.
Processing answers what should happen while the data is moving. A processor can parse a log, standardise a field, add a service owner, redact a card number, aggregate repeated messages, sample traces or calculate a metric from a stream of events.
This stage contains the difficult decisions. A routine health check and a rare payment failure may each occupy one line. Their operational value can be worlds apart.
Routing answers who needs the information and how quickly. Payment failures may go to an observability platform. Authentication events may go to a security system. Raw records may go to lower-cost object storage. A regulated record may go to an archive with longer retention.
A telemetry pipeline can send one signal to several destinations. This supports different teams, storage tiers and vendor migrations.
The official OpenTelemetry Collector architecture guide describes this flow through receivers, processors and exporters. These components define the path followed by each telemetry signal.
The three-stage diagram looks tidy. Production systems have a habit of being less tidy. Every record forces the telemetry pipeline to make five deeper decisions.
These decisions explain why telemetry pipeline architecture involves more than moving data between two boxes. It is a live decision system working under changing volume, changing applications and a very patient monthly bill.
Every byte of telemetry consumes resources. It travels across a network, passes through processors, enters storage and may be indexed for search. Repetitive data can consume a large share of an observability budget while adding very little new information.
Many observability platforms charge according to the data they ingest, index or retain. A successful health check can repeat millions of times and increase the bill each time, even when the millionth message teaches the team very little.
The cost extends beyond the platform invoice. Engineers maintain filters, review ingestion rules and ask development teams to reduce logging. Each hour spent controlling telemetry volume is an hour removed from product delivery, reliability work or customer-facing improvements.
Consider three log messages.
The order number changes, so a simple comparison sees three different messages. A pattern-aware telemetry pipeline can recognise their shared structure as Payment status check completed for order followed by a variable value.
The telemetry pipeline can count that pattern during a time window and forward a summary. It can preserve the order ID when an investigation requires it, group records by service or environment and keep the original messages in lower-cost storage.
Now imagine a new message appears saying Payment status check failed after gateway timeout. This pattern carries fresh information. It deserves immediate attention and richer context.
This is the real judgement behind telemetry management. Repetition can become a summary. A change in behaviour remains visible. Raw evidence stays available for deeper investigation.
The business effect follows the same path. Compact summaries reduce premium ingestion and storage. Preserved exceptions protect troubleshooting. Automated decisions return engineering time to work that can improve the product and serve customers.
Sampling offers another form of reduction. Head sampling chooses at the start of a request. Tail sampling waits until the request finishes and can use latency, status and other details. The OpenTelemetry sampling guide explains the factors teams should consider when choosing a sampling strategy.
A telemetry pipeline is production infrastructure. It receives traffic bursts, slow destinations and occasional surprises from fields that were introduced five minutes before lunch.
Suppose applications produce 50,000 records each second while a destination accepts 30,000. The remaining records begin filling a queue. As the queue grows, the time between creation and arrival grows too. An alert that reaches an engineer twelve minutes late has technically arrived. It has also missed the exciting part.
Backpressure is the pipeline response to this imbalance. It slows upstream work, adds capacity or places records in durable storage until the destination catches up. Retry policies handle temporary failures. Load balancing spreads work across processors. Durable queues protect records during restarts.
A healthy telemetry pipeline measures incoming volume, outgoing volume, processing delay, queue size, rejected records and dropped records. Comparing what entered with what left reveals loss. Measuring the age of the oldest queued record reveals delay.
The system built to explain production also needs an explanation of its own behaviour. Airports inspect baggage scanners. Telemetry teams inspect collectors. Machines also enjoy supervision, although they express gratitude in a limited way.
The terms telemetry pipeline and observability pipeline often describe similar technology. Their clearest difference comes from scope.
A telemetry pipeline can prepare and route operational data to observability platforms, security systems, analytics tools, AI systems and archives. An observability pipeline usually focuses on monitoring, troubleshooting and reliability workflows.
Many vendors use both terms for related products. Buyers gain more clarity by examining supported signals, processing features, destinations, governance controls and deployment models.
The search telemetry pipeline vs observability pipeline reflects a real buyer question. Telemetry describes the data and its movement. Observability describes one major use of that data.
A small application sending modest data to one backend may use a direct connection. A dedicated telemetry pipeline becomes valuable as sources, destinations, volume and cost multiply.
Common signs include the following.
The decision should follow operational pain. Architecture diagrams have a charming ability to make every additional box look essential. Daily engineering work offers a more reliable test.
Traditional telemetry management often depends on instructions written by engineers. Keep these errors. Sample these traces. Parse this field. Send this service to that tool.
The rules may work beautifully on Monday. On Tuesday, a team renames a service. On Wednesday, a developer changes the log format. On Thursday, an AI agent produces ten times more spans. By Friday, the rulebook describes a system that existed four days ago.
A fixed rule follows its instruction with impressive loyalty. It can apply yesterday's decision until an engineer discovers the effect in a bill, a dashboard or an incident review.
Large organisations may carry thousands of rules across teams and destinations. Every parser needs maintenance. Every filter needs review. Every change needs testing. Telemetry management slowly becomes a software product hiding inside the engineering organisation.
An autonomous telemetry pipeline adds continuous pattern detection to collection, processing and routing. It studies telemetry while the data moves and updates its understanding as new patterns appear.
For logs, the pipeline can separate the stable words in a message from changing values. It can count each pattern, recognise repetition and preserve patterns that appear unusual. For traces, it can group requests by their path and outcome, then retain the signatures that carry greater investigative value.
Autonomy also needs context. A dashboard query, an alert or a business rule may reveal that a particular field matters even when its records appear repetitive. A capable autonomous telemetry pipeline uses this operational intent when deciding what receives full detail.
The purpose is practical. Engineers spend less time maintaining routine rules. The telemetry pipeline continues protecting important signals as applications and traffic evolve.
Grepr is the Intelligent Operations Platform built around an autonomous telemetry pipeline. It sits between telemetry sources and existing observability platforms, before expensive ingestion and indexing.
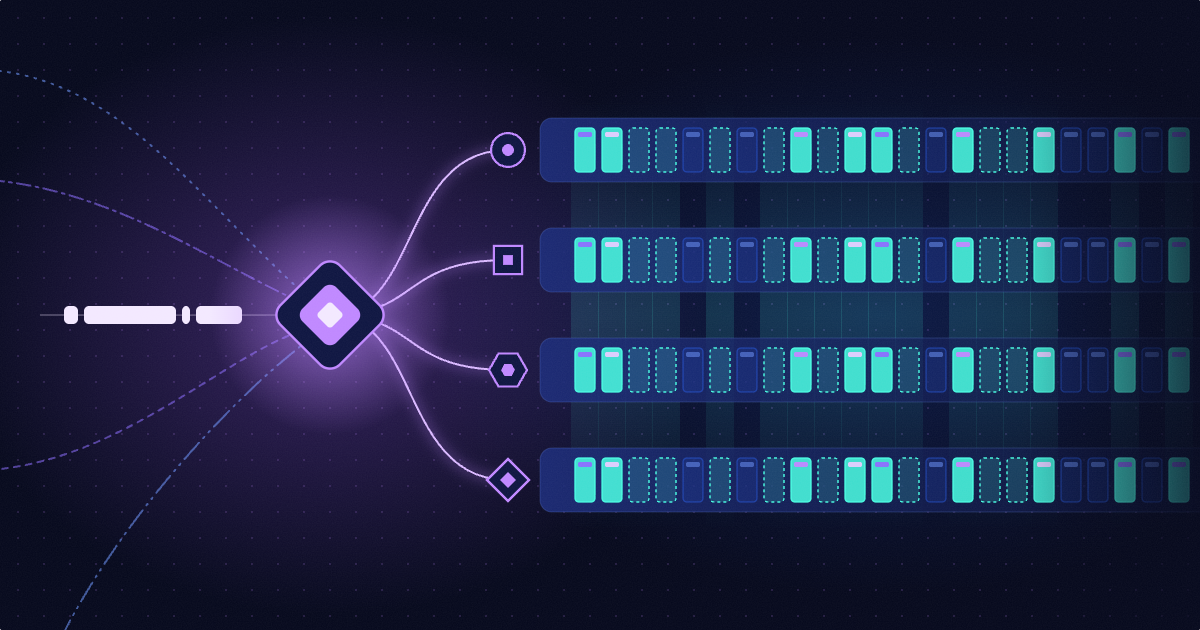
Grepr uses pattern mapping to identify repeated log structures in real time. It keeps a count for each pattern. Once a pattern crosses a noise threshold, Grepr can aggregate future occurrences and forward a summary showing the pattern and its frequency. New and unusual patterns continue downstream with richer detail.
The reduction remains configurable. Teams can preserve values such as customer IDs, status codes, IP addresses or URL paths. They can group by service or environment so records from separate parts of the system receive separate summaries. Grepr can also calculate statistics from values inside repeated messages.
Grepr reads existing dashboards and alerts through its query translation engine. Queries can become exceptions that protect the data those dashboards and alerts depend on. This gives automated telemetry management an understanding of current engineering workflows.
Raw telemetry flows to lower-cost storage. During an incident, an internal anomaly or an external trigger can increase forwarding detail and start a backfill. The telemetry pipeline retrieves relevant historical records and sends them to the investigation tool, giving engineers context from before and after the trigger.
Grepr also supports stateful streaming SQL. This allows a telemetry pipeline to join events across services and time. Ten failed logins followed by a successful login and access to a sensitive service can become one meaningful sequence. A checkout that receives bank approval and then fails to create an order can become another.
That connected checkout sequence can create an event while the customer journey is still recent. The business can contact the customer, protect inventory, begin payment reconciliation or open a support case. Telemetry has moved beyond explaining a lost sale. It can help the company recover the sale and protect the customer relationship.
Grepr works with tools such as Datadog, Splunk, New Relic, Grafana Cloud and OpenTelemetry-compatible platforms. Applications and dashboards can continue working while the telemetry pipeline changes how data is processed before premium ingestion.
A published Jitsu case study shows this in production. Jitsu manages millions of shipments, with more than 400 logs generated for each shipment. Most shipments complete successfully, yet every successful journey still creates hundreds of records. Sending all those records to premium observability storage meant paying repeatedly for evidence that largely confirmed healthy operations.
Jitsu still needed full records when a shipment failed and required investigation. Grepr reduced its Datadog log costs by 90 percent while preserving established dashboards, troubleshooting workflows and a 13-month archive. Deployment took less than one hour and produced zero reported impact on mean time to resolution.
The ROI came from several places. Jitsu lowered its Datadog bill, preserved engineering workflows and avoided a large manual filtering project. Its team could continue supporting millions of shipments while observability costs grew at a slower rate than telemetry volume.
The Grepr platform overview explains how pattern detection, summaries, raw storage, query translation and backfill work together as an autonomous telemetry pipeline.
Observability teams have traditionally faced a painful choice. Sending every record to a premium platform provides rich detail and creates a large bill. Reducing the stream lowers cost and can remove context that becomes valuable later.
Backfill changes the shape of this decision. During ordinary operation, the telemetry pipeline forwards high-signal records and compact summaries. Raw records remain in economical storage. When an anomaly appears, the telemetry pipeline increases detail and reloads relevant history into the observability platform.
Imagine a host behaving normally at 2.00 p.m. Repeated logs arrive as summaries. At 2.07 p.m., latency rises sharply. That metric triggers full-granularity forwarding for the host and retrieves the raw records leading up to the change. The engineer receives the calm period, the transition and the failure in one investigation.
This gives telemetry management a more useful goal. Full evidence remains available, while premium indexing follows operational need.
A telemetry pipeline creates value across several parts of the business. The observability invoice provides the easiest number to see. The larger return often includes engineering capacity, shorter incidents and protected customer revenue.
Reducing repetitive telemetry before premium ingestion lowers the amount of data a company pays to index and retain. Grepr customers have reported log-volume reductions around 90 percent, with results shaped by each company's telemetry mix. A system filled with repeated health checks, retry messages and routine lifecycle events offers greater reduction potential than a smaller, highly varied stream.
This saving appears quickly because Grepr sits before premium ingestion. The company can continue using existing observability platforms while sending them a smaller stream of summaries and higher-value signals.
Static filters, parsing rules and routing policies require ongoing maintenance. Every service and log format adds another small job. Small jobs are sociable creatures. They soon form a department.
Automated telemetry management reduces that routine work. Platform and SRE teams can use the recovered time for reliability improvements, product delivery and customer problems that require human judgement.
A customer-facing incident carries a cost for every minute it continues. Revenue may slow. Support volume may rise. Engineers and leaders move away from planned work. Cleaner signal helps teams locate unusual behaviour faster, while backfill returns detailed history when the investigation needs it.
The value depends on the business. An online retailer may track lost checkout revenue per minute. A logistics company may track delayed shipments and support contacts. A financial platform may track failed transactions, reconciliation work and customer risk.
A telemetry pipeline can connect a technical failure with the customer journey affected by it. Teams can identify which orders, accounts, payments or transactions require action. Stateful streaming SQL can also create real-time events for customer recovery, payment reconciliation or operational intervention.
This turns telemetry into an operating input. The data can help explain a revenue problem, measure its reach and trigger a response while recovery remains possible.
Annual Grepr value can be estimated through four parts. Observability savings, recovered engineering capacity, avoided incident loss and recovered customer revenue.
Imagine a company spends one million dollars each year on telemetry ingestion. A 75 percent reduction in the premium stream represents 750,000 dollars in potential annual platform savings before the cost of Grepr.
Now imagine five engineers spend four hours each week maintaining filters, pipelines and logging policies. That work uses more than 1,000 engineering hours each year. Returning part of that capacity adds another measurable benefit.
The calculation becomes stronger when the company adds incident exposure and recoverable transactions. Grepr then becomes a business case covering cost control, engineering productivity, resilience and revenue protection.
A useful evaluation begins with the decisions the telemetry pipeline must make during daily work.
Performance matters as well. Teams should test throughput, end-to-end delay, autoscaling behaviour, queue growth and recovery after a destination outage. A telemetry pipeline earns trust during the unusual hour, rather than during the friendly architecture meeting.
A telemetry pipeline succeeds when engineers can find trustworthy evidence during an unfamiliar problem and when the company can sustain that capability as its systems grow.
The airport succeeds when the correct suitcase reaches the correct destination. When a bag disappears, staff can find the last scan and act before the passenger spends three days wearing an airport gift-shop T-shirt.
Software deserves the same standard. Teams need to see where a customer journey failed, how much of the business it affected and which action can recover it.
Grepr brings those decisions into the telemetry stream. It reduces the cost of routine data, preserves full evidence for important moments and turns live operational signals into actions that protect engineering time, customer experience and revenue.
A telemetry pipeline collects logs, metrics, traces and events from applications and infrastructure. It adds context, changes formats, protects sensitive fields, reduces repetition and routes each signal to a suitable destination. The telemetry pipeline turns scattered technical records into evidence that engineers can search and understand.
A telemetry pipeline receives data from agents, applications and collectors. Processors parse, enrich, aggregate, sample or redact the records. Exporters send the results to observability platforms, security systems, analytics tools or storage. Production telemetry pipeline architecture also includes queues, retries, scaling and monitoring for the pipeline itself.
The main telemetry signals are logs, metrics, traces and events. Logs record occurrences inside a component. Metrics show numerical change over time. Traces follow a request across services. Events record meaningful changes such as a deployment. Shared identifiers help these signals describe one system journey together.
The phrase telemetry pipeline vs observability pipeline describes a difference in scope. A telemetry pipeline can send operational data to observability, security, analytics, AI and archival systems. An observability pipeline usually concentrates on monitoring, troubleshooting and reliability. Product capabilities matter more than the label used by a vendor.
OpenTelemetry is an open-source framework for generating, collecting and exporting telemetry. The OpenTelemetry Collector can form a telemetry pipeline through receivers, processors and exporters. Connected platforms usually provide storage, search, dashboards and analysis.
Telemetry management controls how operational data is collected, processed, stored and routed. It covers quality, cost, privacy, retention, sampling, governance and pipeline health. Strong telemetry management keeps valuable evidence available and places each signal in a destination suited to its urgency and value.
An autonomous telemetry pipeline detects patterns and changes while data is moving. It can identify repetition, preserve unusual signals and adapt processing as services evolve. Operational context from dashboards, alerts and policies helps guide those decisions. Testing and clear controls help engineering teams supervise the automation.
Grepr uses real-time pattern mapping to separate repeated telemetry from higher-value signals. It forwards summaries and useful detail to existing observability tools, preserves raw records in lower-cost storage and can backfill historical detail during an incident. Query translation protects data used by existing dashboards and alerts, while stateful streaming SQL supports correlation and real-time action.
A business can combine four values. Direct observability savings, engineering hours recovered from rule maintenance, incident losses avoided through faster investigation and customer revenue recovered through real-time action. The strongest ROI model uses the company's current platform spend, engineering cost, incident history and transaction value.