

Observability vendors like to tell us that all data is important all the time and that if you do not collect absolutely everything in microscopic detail you’ll regret it. They promote FOMO (fear of missing out) preaching that the piece of data you chose not to collect is exactly the item you need to solve an issue and there’s going back in time to get it; the horse has bolted and you missed the chance to close the stable door. Of course they often fail to point out that they charge by data volume; the more you send, the better it is for their shareholders.
Different Levels Of Equality
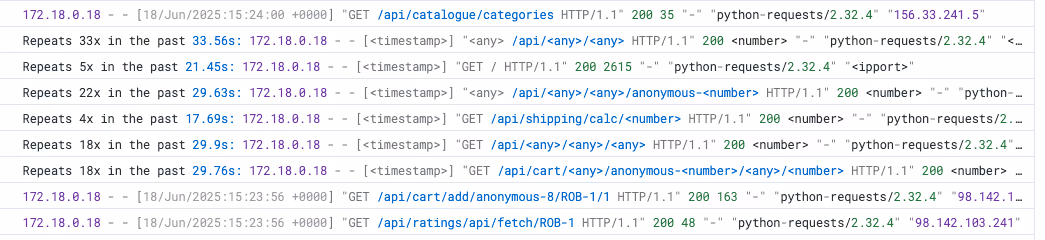
Observability data falls into one of two categories: heartbeat or heart attack. Some data is required all the time to provide heartbeat confirmation, with the absence of this data being a cause for alarm. For example the access logs for a web server, it’s comforting to see requests passing through with 2XX status codes. This gives us a warm feeling that the website is up and serving requests in a prompt and error free manner.

Should the web server access log fall silent, this is a cause for concern. Either our website has suddenly become immensely unpopular or something broke. It is under these heart attack circumstances that the rest of the observability data suddenly becomes handy.
Every Heartbeat
It’s agreed that heartbeat observability data is essential to ensure service continuity by providing the data for alerting, is every log line really necessary, can we skip a heartbeat or two? There’s that FOMO feeling again. All that is really required to know all is well is that the number of 2XX status log entries is steadily increasing. However, if those log entries are being used to create a metric then skipping a beat or two would have consequences on metric precision.
Step Back In Time
When attempting to resolve an issue, every morsel of observability data is indispensable to assist in determining the root cause. This is where FOMO really kicks in and Murphy’s Law comes into force. It is surely a complete certainty that the data you chose not to collect is exactly the data you need. If only it was possible to step back in time and collect the missing data, then the root cause would be obvious and service level objectives would be promptly restored.
Heartbeat Summaries
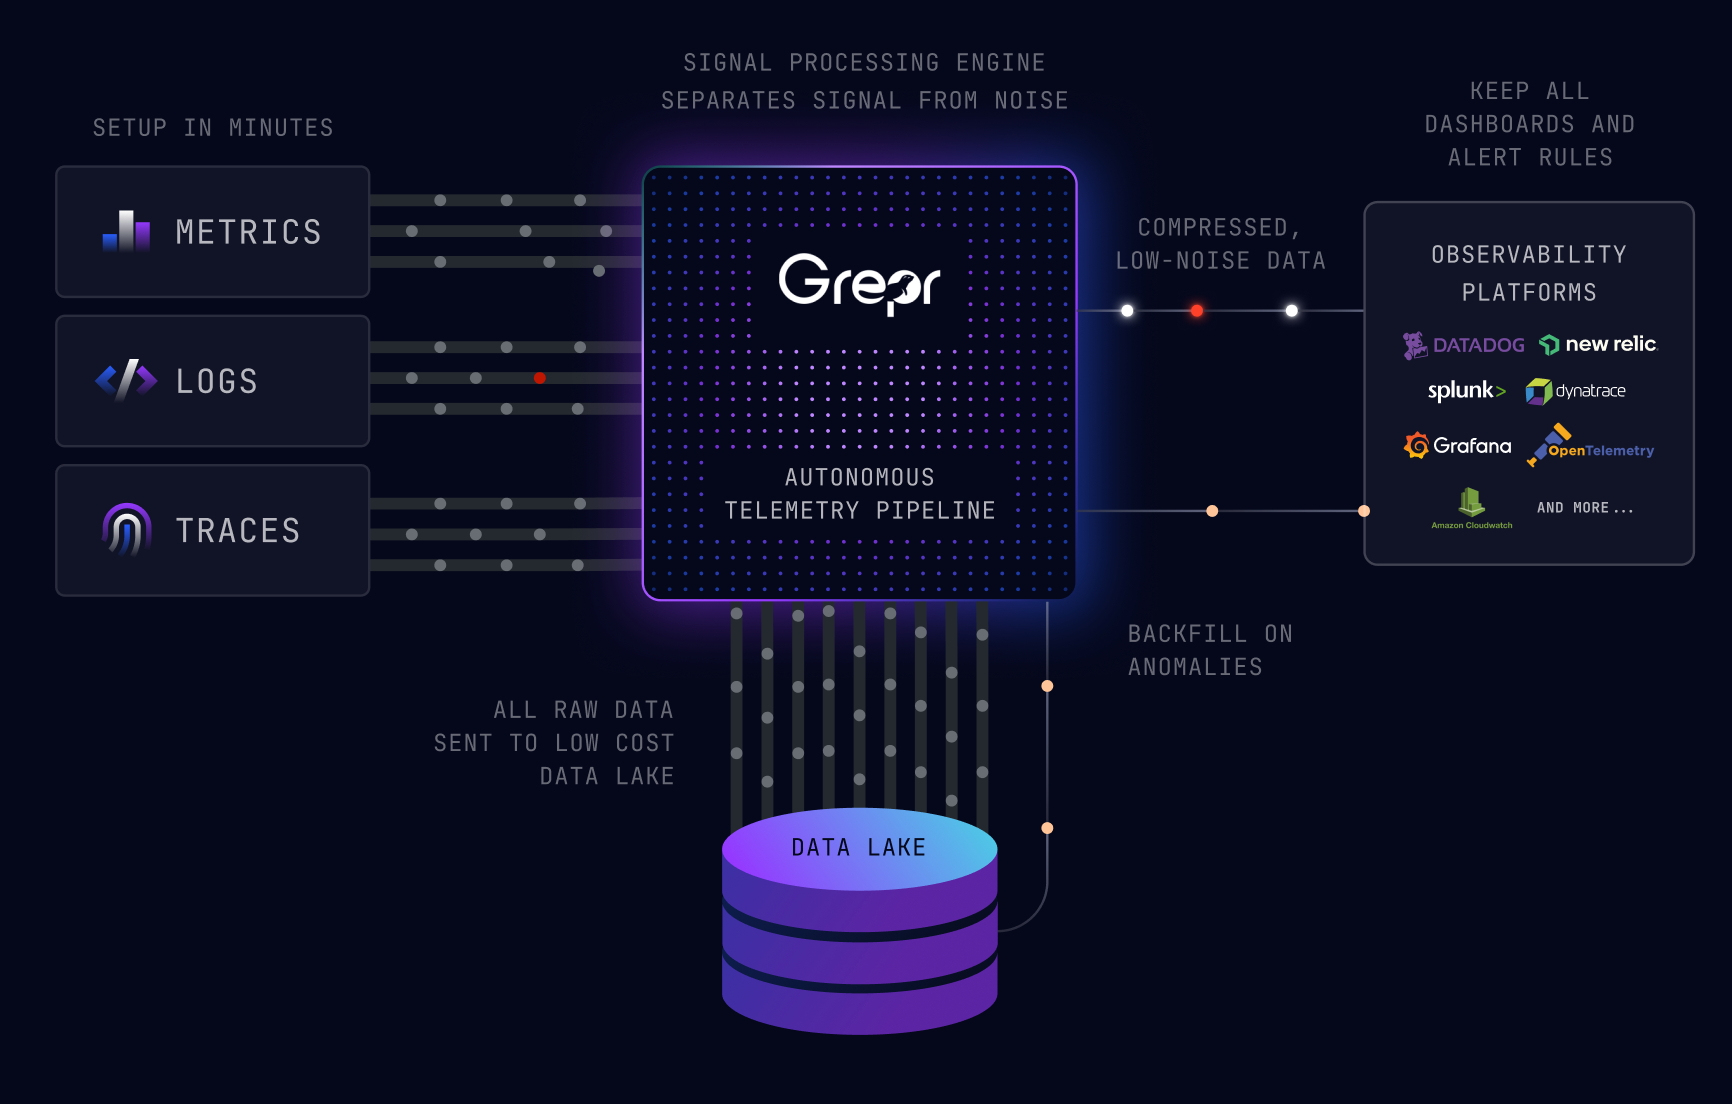
Grepr’s AI powered data pipeline analyses the semantics of observability data in real time. It dynamically manages a set of transformation rules that reduce data volume by 90%, consequently reducing the observability platform costs by a similar amount. Taking web server access logs as an example, frequent messages are summarised while sparse messages are passed straight through.
As well as summarizing, the dynamic transformation rules also add supplementary metadata. The extra metadata is used to ensure total accuracy of any derived metrics.
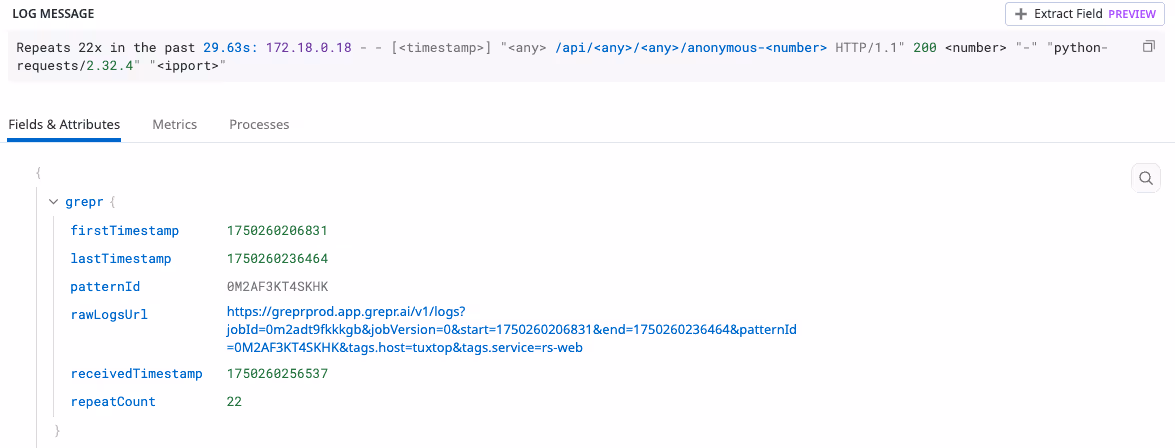
The grepr.repeatCount field is used as the basis for metric generation; this will be 1 for messages that are not summarized.
Time Travel Is Possible

All data sent to Grepr is retained in low cost storage, no data is dropped. It gets even better, that data is available to query with a language you are already familiar with: Splunk, Datadog, New Relic and more coming soon. Using the Grepr web dashboard the entire dataset is available to assist in identifying the root cause of issues. The results of a query can optionally be submitted as a backfill job making the data quickly available on your observability platform. It’s like stepping back in time and turning up the detail just before the issue occurred. Continue to use the same workflows in the tool you are already familiar with; zero disruption and no learning curve. Backfill jobs can also be triggered automatically via web hook and query matches.
Don’t Miss Out
With Grepr you no longer have the fear of missing out, you can collect it all and not fear the cost implications. Heartbeat data is summarized and heart attack response data is immediately available via backfill. With Grepr you achieve 100% insight with 10% data and contain observability platform expenditure.
More blog posts
All blog posts
How Envoy Reduced Observability Data Volume by 90% Without Touching a Single Dashboard
Grepr Just Launched a Free Tier: Reduce telemetry noise by 90%

Grepr Wins the 2026 Intellyx Digital Innovator Award for Observability Cost Reduction
Get started free and see Grepr in action in 30 minutes.
