

The scary question we get asked most frequently is “What if I need to find a log entry that Grepr aggregated away? What do I do then?”
Grepr uses unsupervised machine learning to automatically reduce the volume of log messages that are sent to observability tools by over 90%. In real-time, Grepr identifies the log patterns that are passing through and tracks the volume of log messages for each pattern. Messages pass through unmodified with low-latency for a pattern until its volume crosses the “deduplication” threshold. At that point, Grepr starts reducing it. At the end of two minutes (default cycle time, configurable), Grepr sends a summary of the messages that were reduced and not passed through. At the next cycle, the whole process starts again: unmodified samples, then reduction, then summary. Summaries emitted by Grepr look like:
<timestamp> Start to flush snapshot state to state backend, table: <any>, checkpointId: <number>
In a summary message, Grepr replaces parameters that change between aggregated messages with a placeholder (<timestamp>, <any>, <number>). This aggregation and summarization is configurable, and it’s possible to tell Grepr not to aggregate certain parameters away. But the biggest question that prospective users often ask us is: “What if I want to search for a parameter that was aggregated away?”. For example, “what if there’s a customer support ticket that comes in, and support people want to see what happened with that customer”? Or “what if I have a request ID for a request that has a problem and I want to search for all related log messages”?
Our answer: when configured well, you’ll almost never run into a situation where Grepr has summarized away a parameter in an important log message. And indeed this has been our experience with our existing customers who almost never have to query the data lake (see Goldsky Case Study for example). Why? Read below.
1. Low-frequency messages are passed through
Grepr’s design always passes through low frequency messages without aggregation. Usually, these are the most interesting messages when there are anomalies, and contain the keys to understanding root causes. If a particular parameter value (say user ID “jad”) an engineer is interested in is associated with the same message as many other values, then there’s not much information to be gleaned from that fact. It’s more interesting to know whether that user had unique messages associated with their ID indicating unique steps taken or unique problems encountered.
A side effect of how Grepr works is that streams of log messages become more readable via eyeballing. Very often, when debugging an issue, I now find myself scanning through the stream of log messages to see if anything interesting occurred, something I couldn’t do before when noisy messages clogged the log stream.
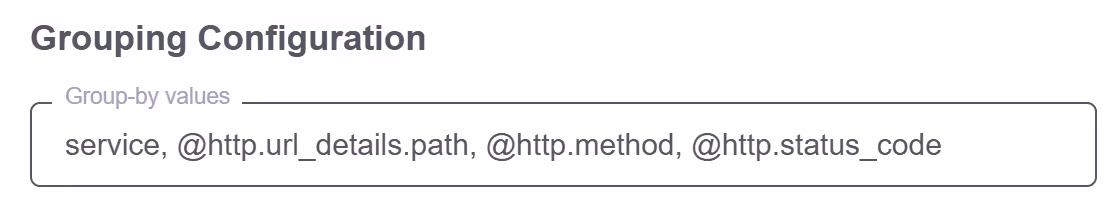
2. Aggregation can be configured to retain specific parameters
Let’s say an engineer does really want to have all user IDs all the time and never aggregate them away. Grepr allows users to parse log messages to extract that user ID using grok rules, and then to specify that user ID as a “group-by” field such that it never gets aggregated away. The downside, of course, is that reduction efficiency may be impacted.
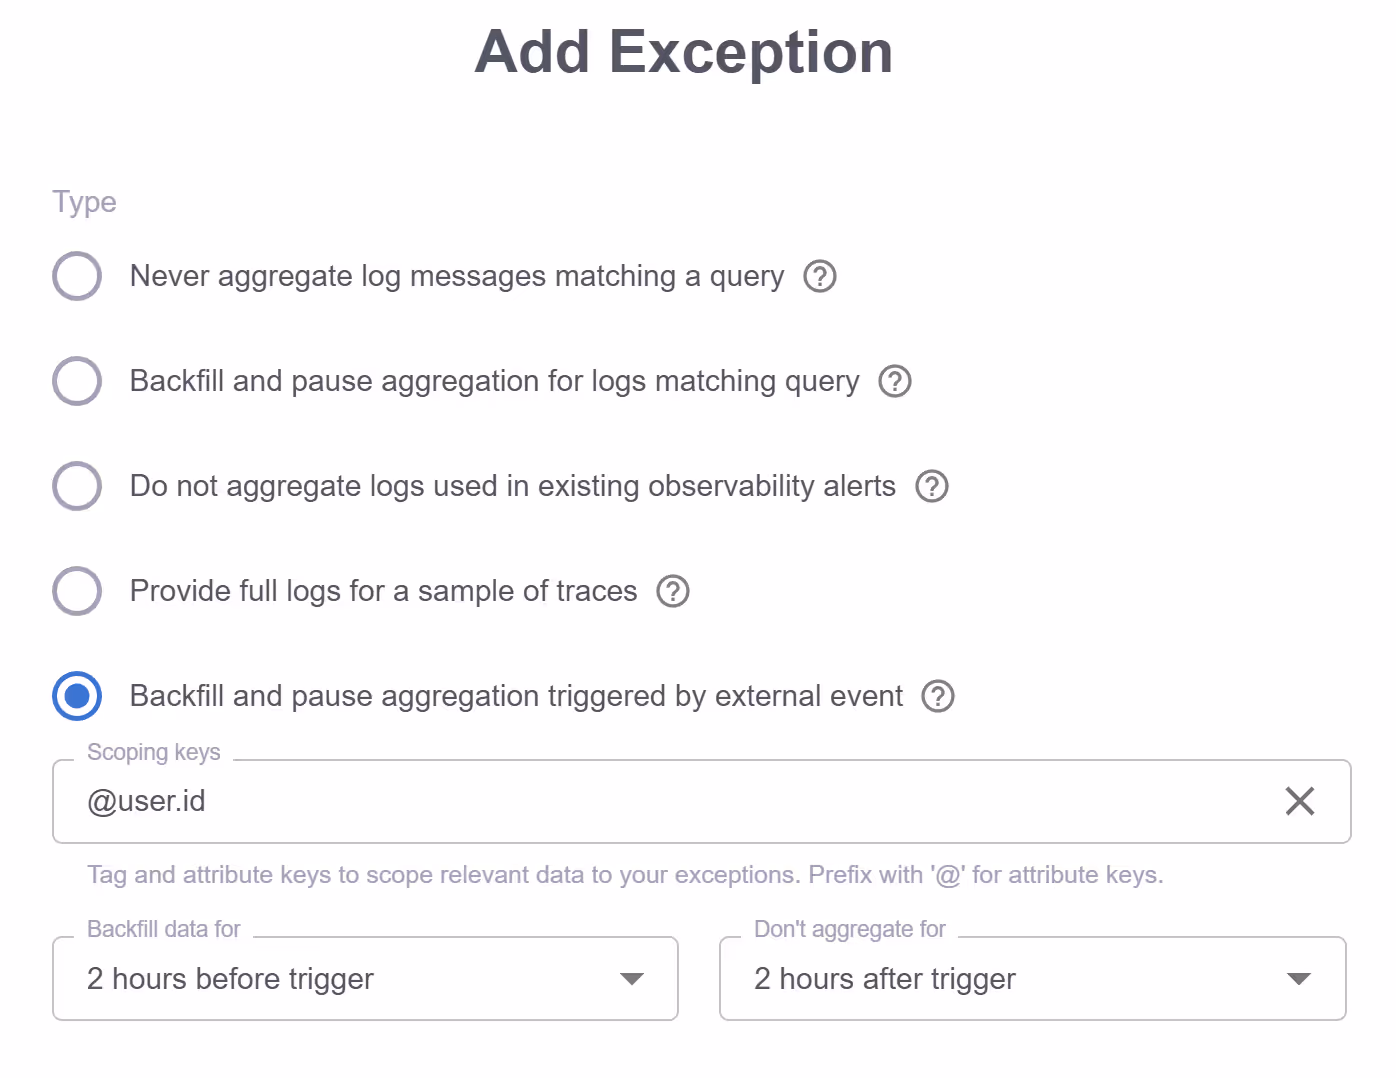
3. Automatic backfilling can load data before it’s needed
What if support engineers are used to looking through all log messages for a particular user when a support ticket is opened to understand what a user is trying to do? No problem: hook up an API call from the ticketing system to Grepr to trigger a backfill for a user’s log messages so that those log messages are loaded automatically when a ticket is opened. Support engineers can then find the log messages when they search for them, without the cost of indexing and storing all that data until it is really needed.
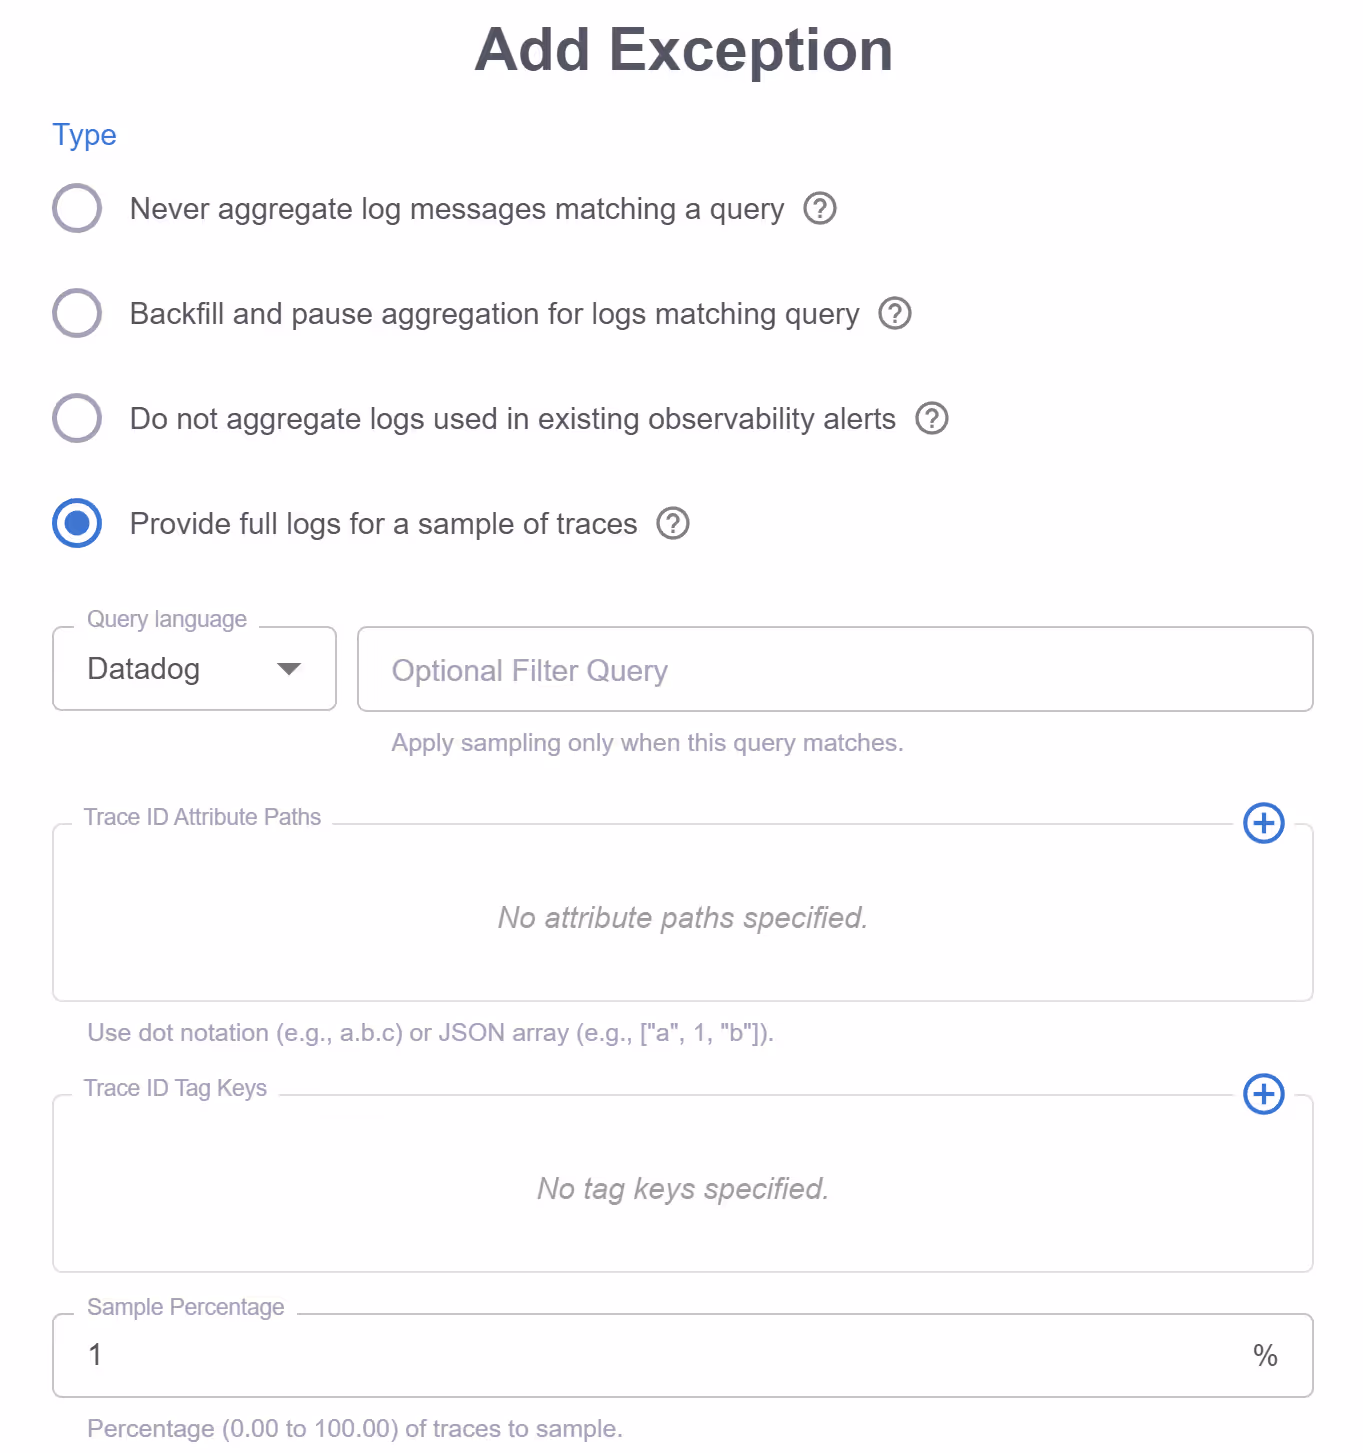
4. Use trace sampling
If all engineers want is to have some full samples of logs for specific users, they can use Grepr’s trace sampling capability to collect full logs for a sample of users and have them available at the destination all the time.
5. If you really need to, you can always search the data lake.
Remember, every log message is archived in low cost storage (typically S3), so none of the data is ever lost, and because we support multiple query languages over the data lake, you can always go back to the data lake to execute a search for a specific parameter using the query language you’re used to (Datadog / SPL / Lucene, NRQL coming soon)
Enabling intelligent trade-offs
Without Grepr, the task of figuring out how to reduce logs is a huge effort when engineers would rather be building features for their products. Grepr automates that work so that it makes a huge difference out-of-the-box (>90% reduction). The effort of tackling this logging issue goes from having to manually go after each kind of log message individually to fine-tuning what messages or what data should continue to be sent without aggregation. This is the only way such massive reductions can happen at an enterprise level.
Using Grepr is low-risk. The data is always in the data lake, it’s easy to change or switch off the aggregation, and it ultimately puts all the control in the engineers’ hands with minimum effort. Grepr enables engineers to make intelligent trade-offs between data granularity and cost, when previously that was impossible.
Getting started with Grepr is free and quick. Try it yourself here!
More blog posts
All blog posts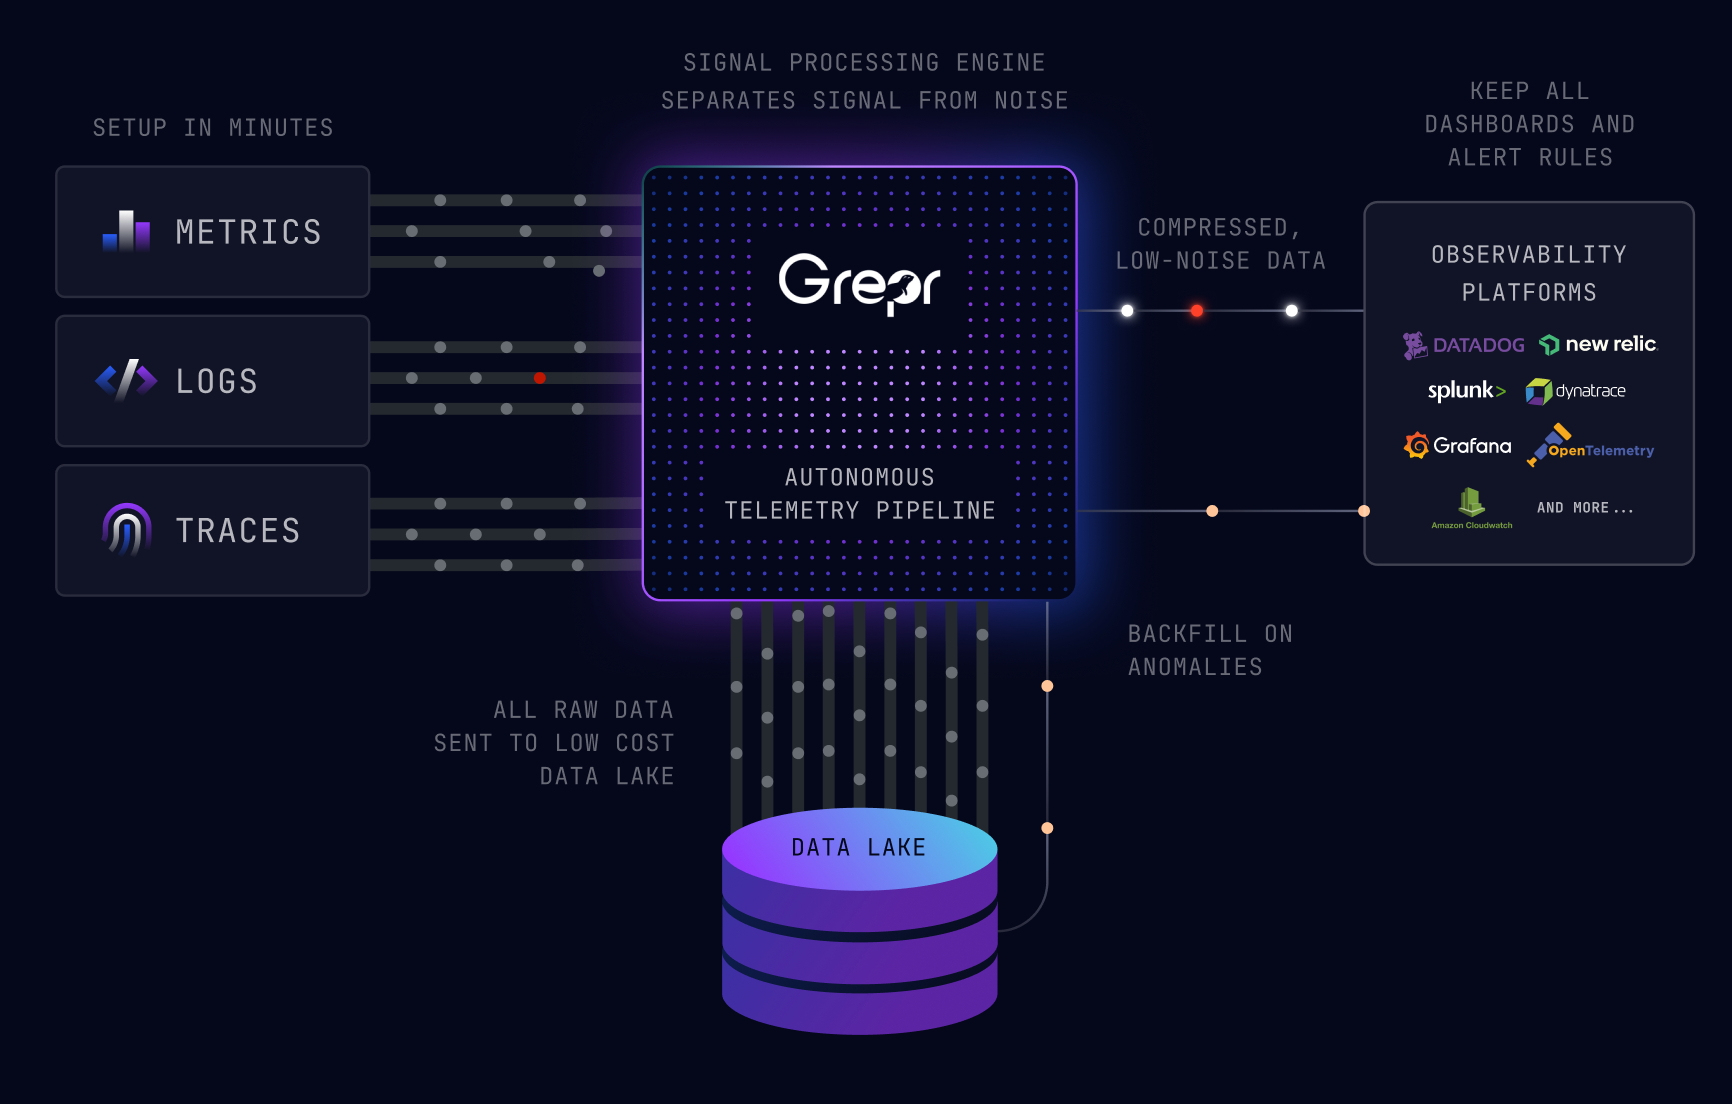
Grepr Just Launched a Free Tier: Reduce telemetry noise by 90%

Grepr Wins the 2026 Intellyx Digital Innovator Award for Observability Cost Reduction

What We Heard at Observability Summit 2026
Get started free and see Grepr in action in 30 minutes.
