Product Features
4 Basic Techniques to Reduce Log Volume and Cut Observability Costs (Part One)

Over the past five years, the rise of Kubernetes and the explosion of microservices have led to an unprecedented increase in the volume of logs generated by applications. Each application today could consist of tens or hundreds of microservices, each of which could have tens of instances running in containers emitting hundreds of log messages per second. Many engineering leaders are driving their teams to reduce observability costs, starting with logs, but often, this is an enormous undertaking that needs to be repeated every few years.
In this blog, I'll highlight four basic techniques for reducing log volumes, comparing their pros and cons. These basic techniques should be available in most log aggregation systems as well as observability pipelines, and while they're simple and unlikely to work sufficiently for an enterprise, they're a good starting point. In the next blog post, I’ll talk about three advanced techniques, and discuss their availability across common tools.
One of the simplest techniques to implement is increasing the severity threshold of either logs emitted at the source or accepted at the log aggregation system. For example, you can increase the threshold from INFO to WARN level, and no longer collect INFO logs.
Changing the log severity emitted at the source can require code changes and can be harder to revert quickly. On the other hand, since the logs are no longer emitted at the source, you would save any costs needed to transmit and collect the logs.
Changing the log severity at the log aggregator would still accrue the cost of delivering the logs. However, you can then change the level of logs indexed/stored at the log aggregator itself, without code changes. It would be easier to revert that change if needed, such as during an incident.
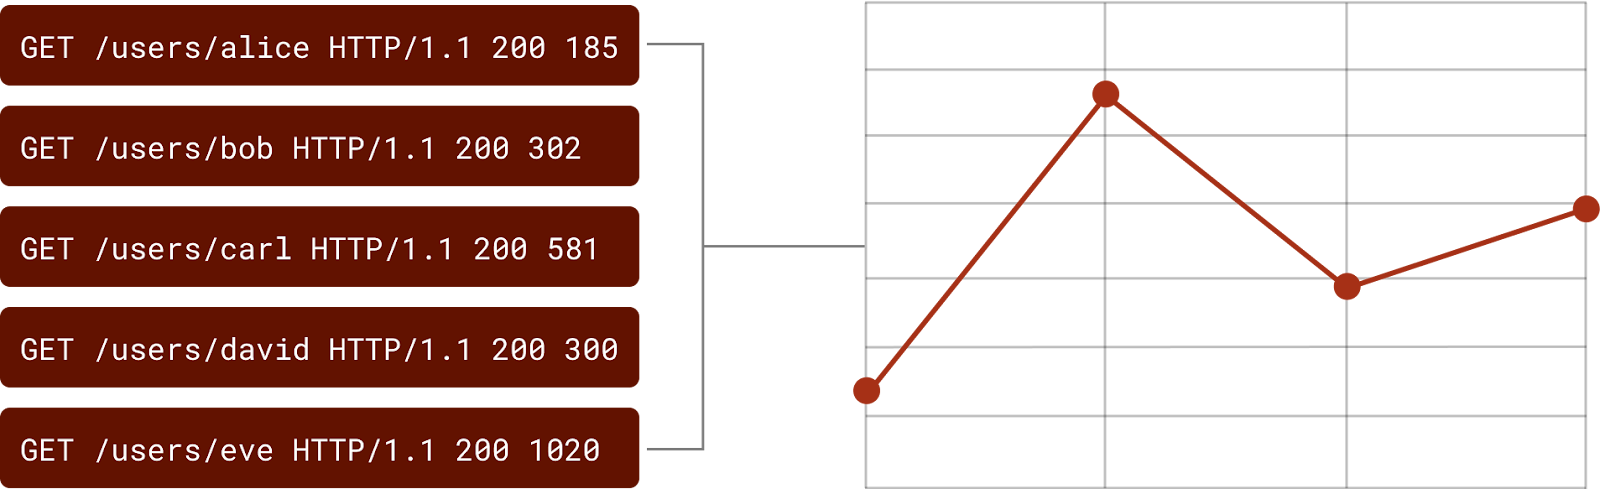
Often, counts of various log messages are used by developers to measure throughput, delay, errors, or other metrics. This is an antipattern since logs are more expensive to process than metrics. Some log aggregation systems and observability pipeline tools allow users to convert log messages to metrics.
A powerful tool that has been recently getting wider adoption is sampling. With sampling, you collect a randomly sampled percentage of messages, say 1 out of every 100. You could apply different sampling ratios at each message severity so that higher severity messages get less sampled or not sampled at all. In Part 2 of this series, we'll talk about Logarithmic sampling, an advanced technique.

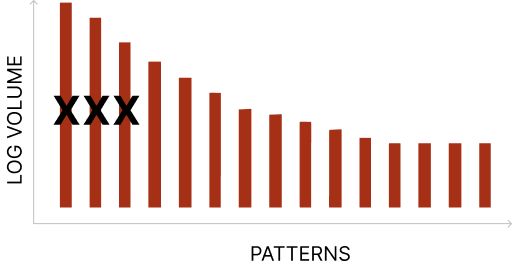
Most modern log aggregators allow a user to count messages by pattern. This can be then used to configure patterns to drop either by the agent collecting the logs at the source or by the log aggregation system when the log messages arrive.
Many tools support all these basic techniques, just like Grepr. In the next blog post, I'll cover some more advanced techniques that allow Grepr to push volume reduction to 90% or more, with minimal impact to existing workflows. If you'd like to see what Grepr can do for you, schedule a demo here or sign up for a free trial here!
Ready for Part Two? Head here!
Increasing the severity threshold is the simplest starting point. By changing the threshold from INFO to WARN level, you can eliminate a large portion of log data with minimal configuration changes, either at the source or at the log aggregation system.
Uniform sampling randomly selects a percentage of all log messages to keep, maintaining statistical patterns across your data. Drop rules target specific log patterns by volume and eliminate them entirely. Sampling preserves proportional representation while drop rules remove selected patterns completely.
It can. Most of these techniques change the absolute count of messages reaching your log aggregator, which means dashboards and alerts that rely on exact values may need updating. This is a key tradeoff to evaluate before implementing any reduction technique.
Yes, and most organizations do. For example, you might increase severity thresholds for low-priority services, convert specific log messages to metrics, and apply sampling to everything else. The right combination depends on your environment's size, complexity, and troubleshooting requirements.