Comparisons
Best Observability Tools in 2026: What They Really Cost You


For three straight years, cost has been the #1 reason teams pick an observability tool, beating out features, integrations, and ease of use (Grafana Labs, 2026).
Most buyer's guides compare tools as if dashboards are what matters, but they aren't. The real difference is architecture: how a platform bills you for data, whether you ever look at it or not.
The 84% waste problem: only 13% of collected telemetry ever gets used, and 84% of companies use less than a quarter of what they collect (Sawmills, 2025).
Picking an observability tool isn't just picking a dashboard. It's choosing how you'll pay for the 80% of data you'll never check.
Observability is simple at heart. It's how well you can tell what's wrong inside a system, just by watching what comes out of it. You don't need to guess, and you don't need to ship new code to find out, because good observability tells you why, fast.
Observability tools are the software that makes this possible. They collect four types of data, metrics, events, logs, and traces, which engineers call MELT for short.
In software, this matters because no single engineer understands the whole system anymore, with too many services talking to too many other services.
Monitoring and observability aren't quite the same thing. Monitoring catches problems you expected, like a threshold breaking or an alert firing. Observability catches problems nobody expected, by letting you ask a new question and get a real answer back from the system itself.
Observability companies split into four groups, though most "best observability tools" listicles blur them into one long, exhausting ranking, like a wedding seating chart nobody asked you to read.
Full-stack APM platforms go first: Datadog, New Relic, Dynatrace, AppDynamics. They handle metrics, logs, and traces under one roof and bill by usage, so if you're after the best APM tools specifically, this is the neighborhood to start house-hunting in.
Open-source and CNCF tools come next: Prometheus, Grafana, OpenTelemetry. Prometheus stores and queries metrics. Grafana puts a face on them, self-hosted or through Grafana Cloud. OpenTelemetry isn't a product at all, it's a free, vendor-neutral standard that feeds data into nearly everything else on this page, the diplomatic Switzerland of telemetry.
Log-first platforms are the third group: Splunk, Sumo Logic, Coralogix, built around search with security features bolted on top. Splunk's query language, SPL, is the most powerful and most expensive way to ask your logs a question.
Cloud-native suites round out the four, led by AWS CloudWatch and X-Ray. If your stack already lives in AWS, this is the path of least resistance. These cloud based observability platforms bill the same way as the rest of your AWS invoice, so at least the confusion stays consistent.
There's a fifth group, and almost no 2026 guide mentions it: telemetry pipelines. Cribl and Grepr live here, ahead of everything above, deciding what data gets through the door before any of it shows up on an invoice. Think of it less as a tool and more as a bouncer with very specific instructions.
Most observability DevOps teams end up running three of these groups at once. Some unlucky teams run all four.
The table below covers what actually matters: query language, AI-agent support, and whether each tool pairs with Grepr.
Cribl is the one exception worth flagging. It sits in the same spot Grepr does, just ahead of your data platform, which makes it a real alternative rather than a partner. That's worth saying upfront, instead of glossing over it.
Three names show up on almost every shortlist: Datadog, New Relic, and Splunk. Each is the stronger pick for a different starting point, and each carries a cost worth knowing in advance.
Datadog is the strongest choice for full-stack coverage in one platform, with the fastest practical onboarding of the three. It's also ahead of most competitors on AI-agent readiness: its MCP Server shipped in March 2026 and already works with Claude Code, Cursor, and VS Code.
The tradeoff sits in two places already covered above. Its query language is proprietary, so none of the tagging or search logic a team builds transfers if they ever switch platforms. And it's billed by usage volume, the exact mechanism behind the 84% waste problem this guide opened with.
New Relic is the better fit for teams that want full-stack APM with a query language that doesn't require a dedicated specialist. NRQL reads like SQL, which makes it the most approachable of the three for a team without someone whose job is writing queries. It was also early to MCP, in preview since November 2025, ahead of Datadog's general availability.
The same volume-based billing exposure applies here, and NRQL is just as non-portable as Datadog's syntax once a team has dashboards built on top of it.
Splunk is the strongest choice for log-first and security or SIEM-heavy use cases, where SPL's search power is genuinely unmatched among the three.
The cost is real, though. SPL has the steepest learning curve of any query language in this guide, Splunk hasn't confirmed an MCP server as of publication, and that search power comes at the highest price point of the three.
Most guides compare sticker prices, but that's the wrong number to watch. Volume drives your bill, not the rate printed on a pricing page.
Remember the 84% figure? If you pay per gigabyte and 84% of your data goes unused, you're paying for waste four days out of five.
That math doesn't change when you switch vendors. New Relic, Datadog, Splunk, it makes no real difference, since the waste follows you unless something cuts it before it's billed.
PromQL, SPL, NRQL, and Datadog's own syntax aren't four versions of the same thing. Each one is built on a different way of storing data.
PromQL handles metrics and math well, but it has no real way to search raw logs. SPL searches logs fast, though it takes real skill to write well. NRQL reads like SQL, so it's easy to pick up if you already know SQL, while Datadog's syntax favors fast, tag-based search. None of the four convert cleanly into each other.
That's the real switching cost: years of dashboards and alerts your team built by hand, none of which move with you to a new platform.
This is the MCP question, and it's a real one in 2026. AI agents need one standard way to reach observability tools instead of a custom plug for each one, and MCP is that standard.
Datadog shipped its MCP Server in March 2026, working with Claude Code, Cursor, OpenAI Codex, and VS Code. New Relic launched its own MCP Server in preview back in November 2025, and Grafana leads the pack with MCP support built into its core stack. Sentry, PagerDuty, and Honeycomb have shipped their own MCP servers too.
Microsoft and AWS built agents that connect through MCP as well. Azure's SRE Agent and AWS's DevOps Agent both went live in April 2026, reaching into Grafana, Datadog, New Relic, and PagerDuty.
Splunk hasn't confirmed an MCP server yet, and neither have a few others on this list, so check current vendor docs before you lock in a shortlist. This part of the market moves fast.
Grepr's own AI SRE Agent is in closed beta, catching problems and reacting in real time. Grepr hasn't shipped a public MCP server yet, so it isn't credited with one here.
Ask these questions in any vendor review:
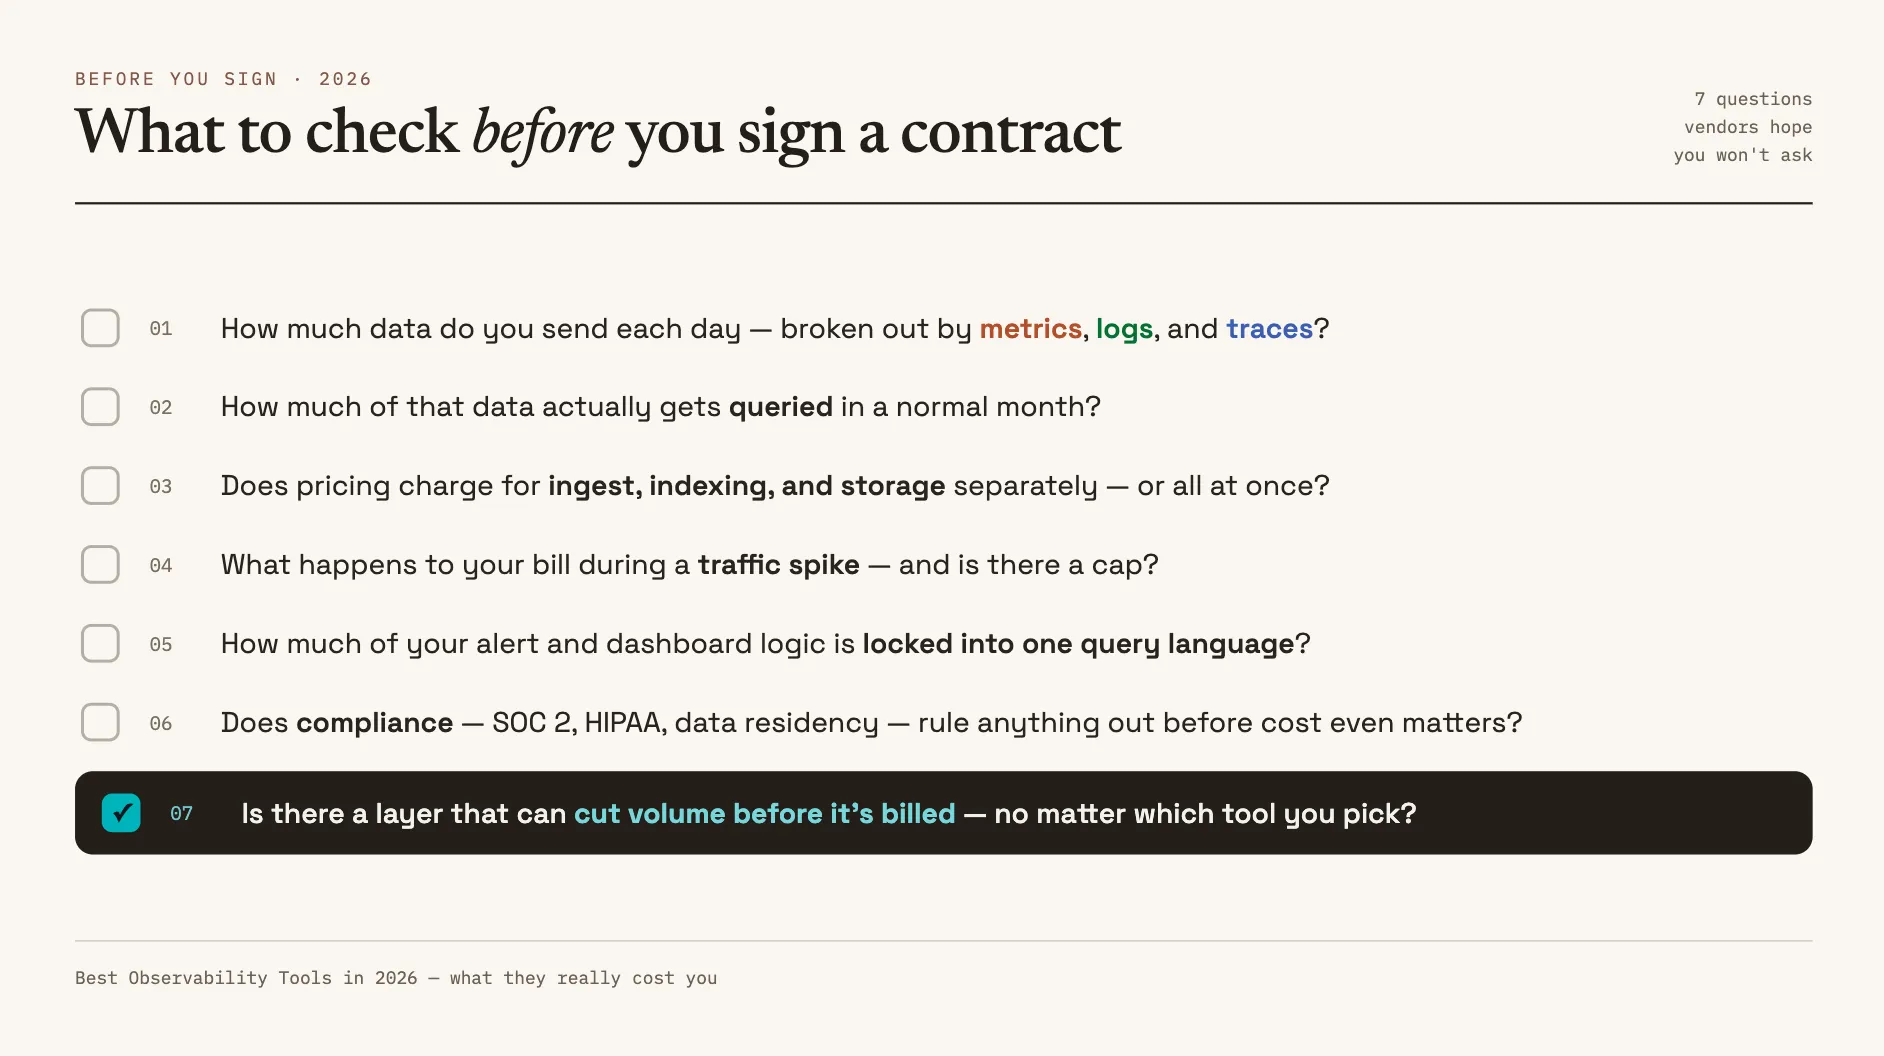
You can pick the best observability tools on this page and meet every compliance box. You'll still pay for that same 84% of unused data, because it's created before any dashboard or AI agent ever sees it.
That's the layer Grepr works in. Grepr finds log lines that repeat with one small change, like a status code or a user ID, and groups them into a single pattern that stops billing you for every repeat.
You keep the fields you choose to keep, and you can still pull full data back later if you need it. It's one config change upstream of Datadog, Splunk, New Relic, Grafana Cloud, or any OpenTelemetry setup, with no new agents and no rewritten pipelines.
Jitsu used Grepr to cut its Datadog log bill by 90% while logging millions of shipments. Fossa cut its log volume by 95%. "We didn't have to change a thing in our app," said Dave Bortz, VP Engineering at Fossa. "I'd recommend Grepr to any team facing rising costs from an expensive logging platform."
Neither team switched observability tools to get those numbers. The tool you pick and the layer in front of it are two separate decisions.
How well you can tell what's wrong inside a system, just by watching what comes out of it, without writing any new code to find out.
Software that collects and connects four types of data: metrics, events, logs, and traces. Engineers call this MELT.
The same idea applied to code and infrastructure: it's what lets a team debug a system too large for one person to fully understand.
Monitoring catches problems you predicted, like a failed alert, while observability catches problems you didn't predict by letting you ask new questions on the fly.
Datadog and New Relic give broad coverage, Splunk fits where security rules apply, and Dynatrace fits where built-in AI analysis matters, ideally paired with a cost layer like Grepr. The best data observability tools in the data-pipeline sense are a separate category, with their own players.
Datadog, New Relic, and Grafana all have one, along with Sentry, PagerDuty, and Honeycomb. Splunk and a few others haven't confirmed one yet, so check again before you decide.
Pick the observability tool that fits your category and your compliance needs, then put a cost layer in front of it so your bill doesn't grow with data nobody checks.
Want to see this against your own logs? Grepr runs alongside whatever tool you already use, with no migration required.