

Teams rely on Grepr to shrink log volume by over 90 percent while keeping every raw event safe in low-cost storage. That reduction makes day to day operations easier, but during an incident you often need to see the exact unaggregated logs that led up to a failure. Pipeline exceptions give engineers that access without changing their setup or interrupting production workflows.
Pipeline exceptions tell a Grepr pipeline to pause aggregation for specific messages and temporarily expose the full raw logs before and after that trigger. Engineers can create these exceptions in the Grepr web dashboard with a few clicks. You choose the trigger, define the scope, and set the time window before and after the trigger where you want unaggregated logs available.

There are two types of exceptions:
- Static rules match a known pattern at all times.
- Dynamic rules activate only when a condition appears in your logs or when triggered by an external API call.
Most teams use dynamic rules for live incident support since they fire automatically when an error or anomaly shows up.
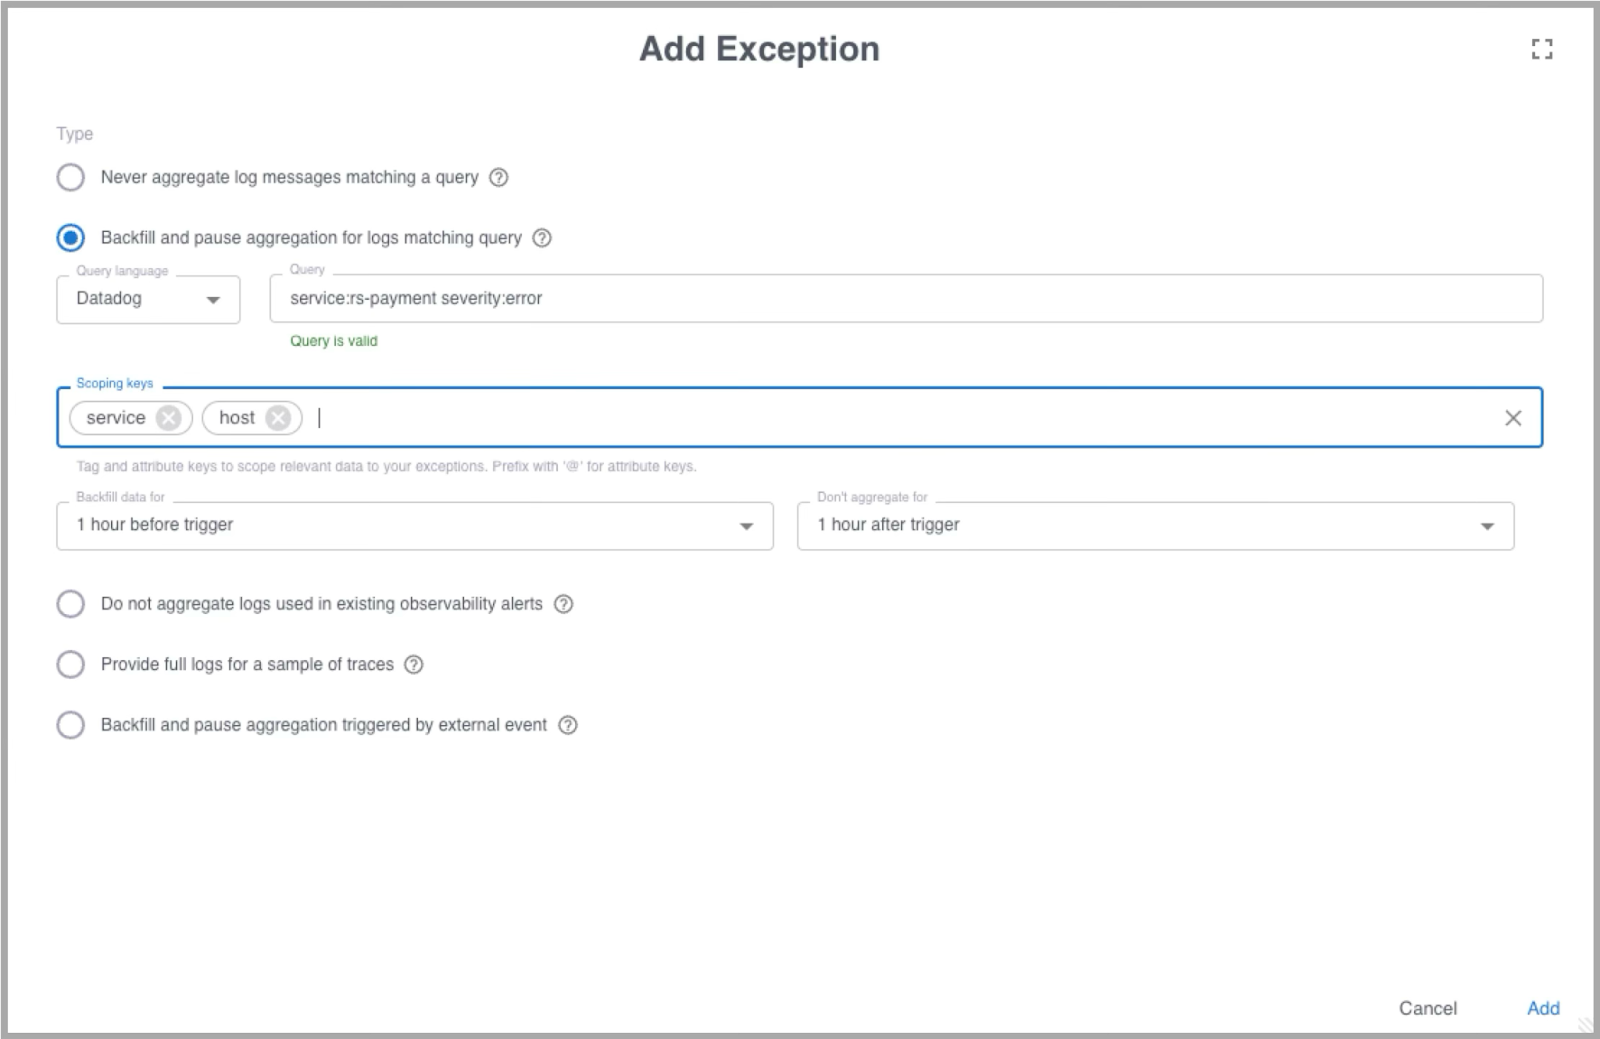
A dynamic exception based on a log trigger begins with a query. This is the condition that activates the exception. For example, you might want the exception to fire when the payment service logs an error. A query like:
service:rs-payment severity:error
will catch that event. Once the trigger is defined, you add scoping keys. Scoping keys help Grepr build a precise query for data backfill and control which data stops aggregating temporarily. If the error happened on host tuxtop then selecting service and host as the scoping keys gives you a refined query:
service:rs-payment host:tuxtop
This makes the exception focus on the exact instance that produced the error rather than every node running the service. It also ensures that the backfill collects only relevant logs from the same context.
The dashboard guides you through the rest. You pick the time period before and after the trigger where Grepr should surface unaggregated logs. This window gives engineers full visibility into what happened leading up to the event and how the system behaved afterward. The entire setup can be tested in the data explorer to confirm the trigger and scoping logic.
Pipeline exceptions give engineers the best of both worlds. You keep Grepr’s log reduction in place during normal operation, and when trouble hits you can instantly access complete raw logs without reconfiguring tools or pulling data from other systems. That improves incident response, shortens MTTR, and protects service quality.
To see the full process in action, watch the video walkthrough here.
Try Grepr now for free and see how teams cut log noise while keeping every raw event available when it matters.
More blog posts
All blog posts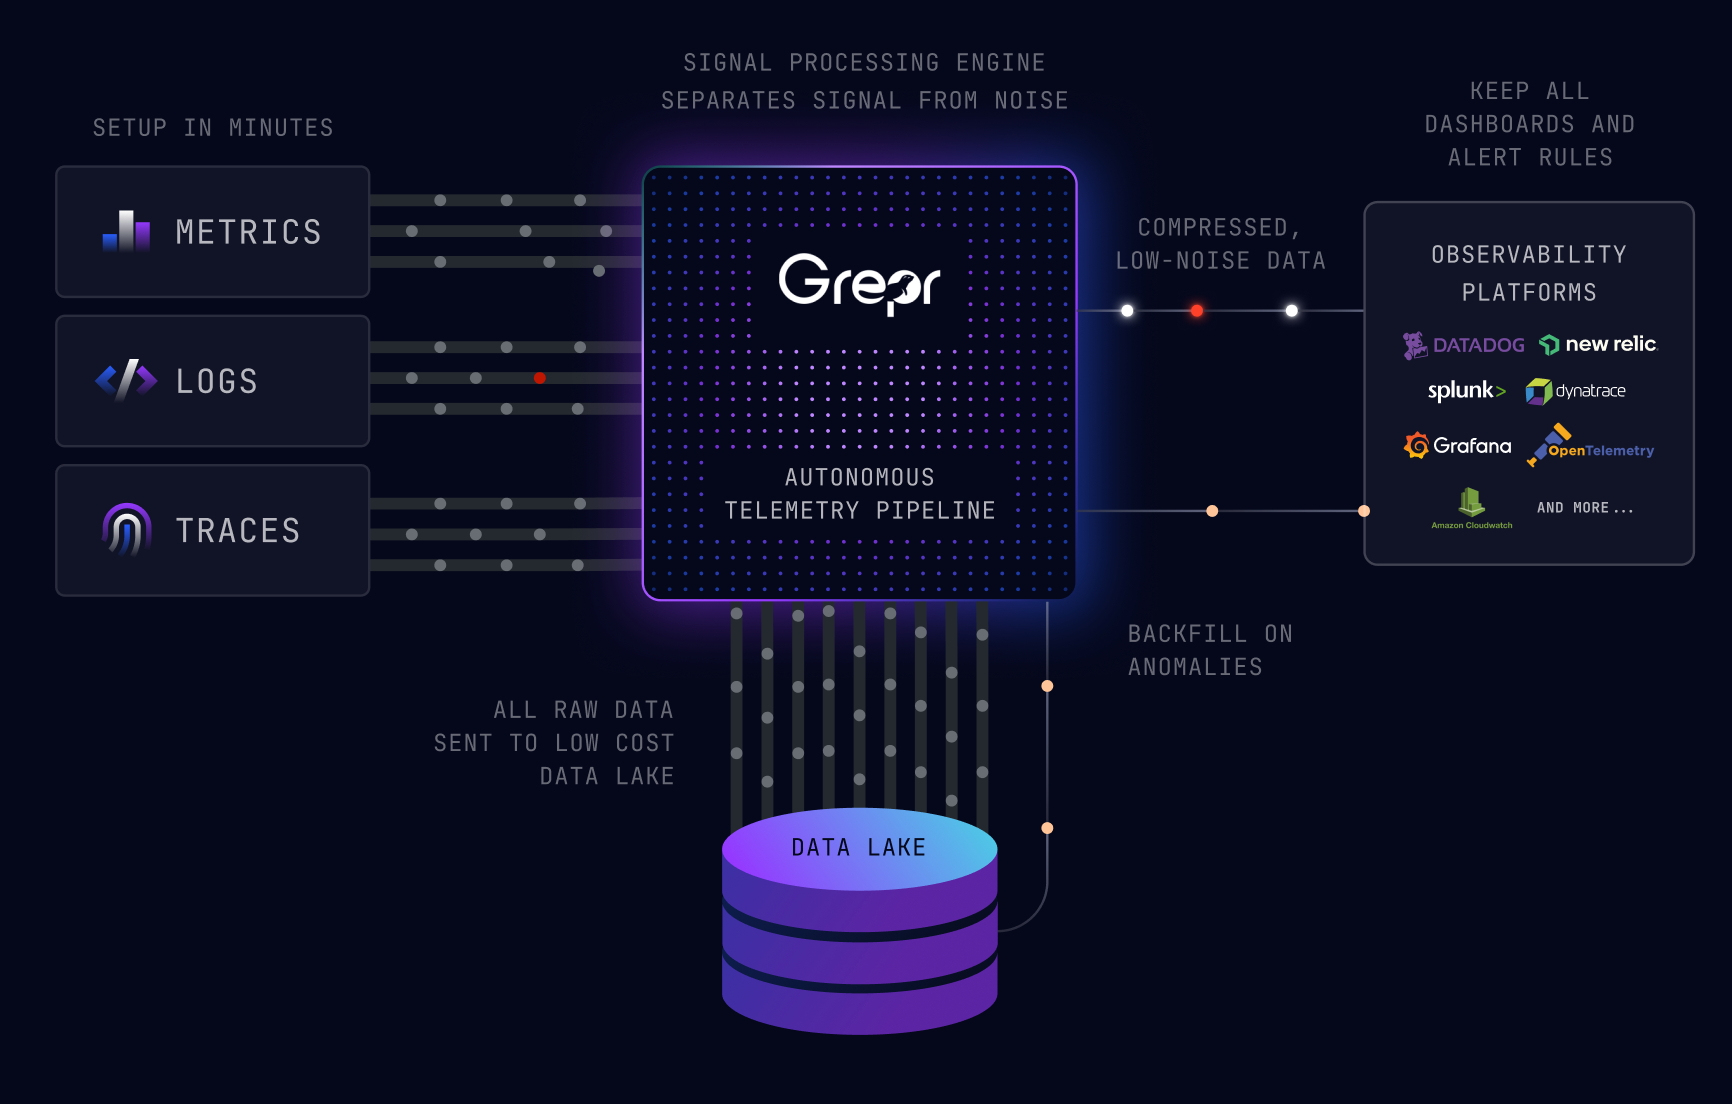
Grepr Just Launched a Free Tier: Reduce telemetry noise by 90%

Grepr Wins the 2026 Intellyx Digital Innovator Award for Observability Cost Reduction

What We Heard at Observability Summit 2026
Get started free and see Grepr in action in 30 minutes.
