
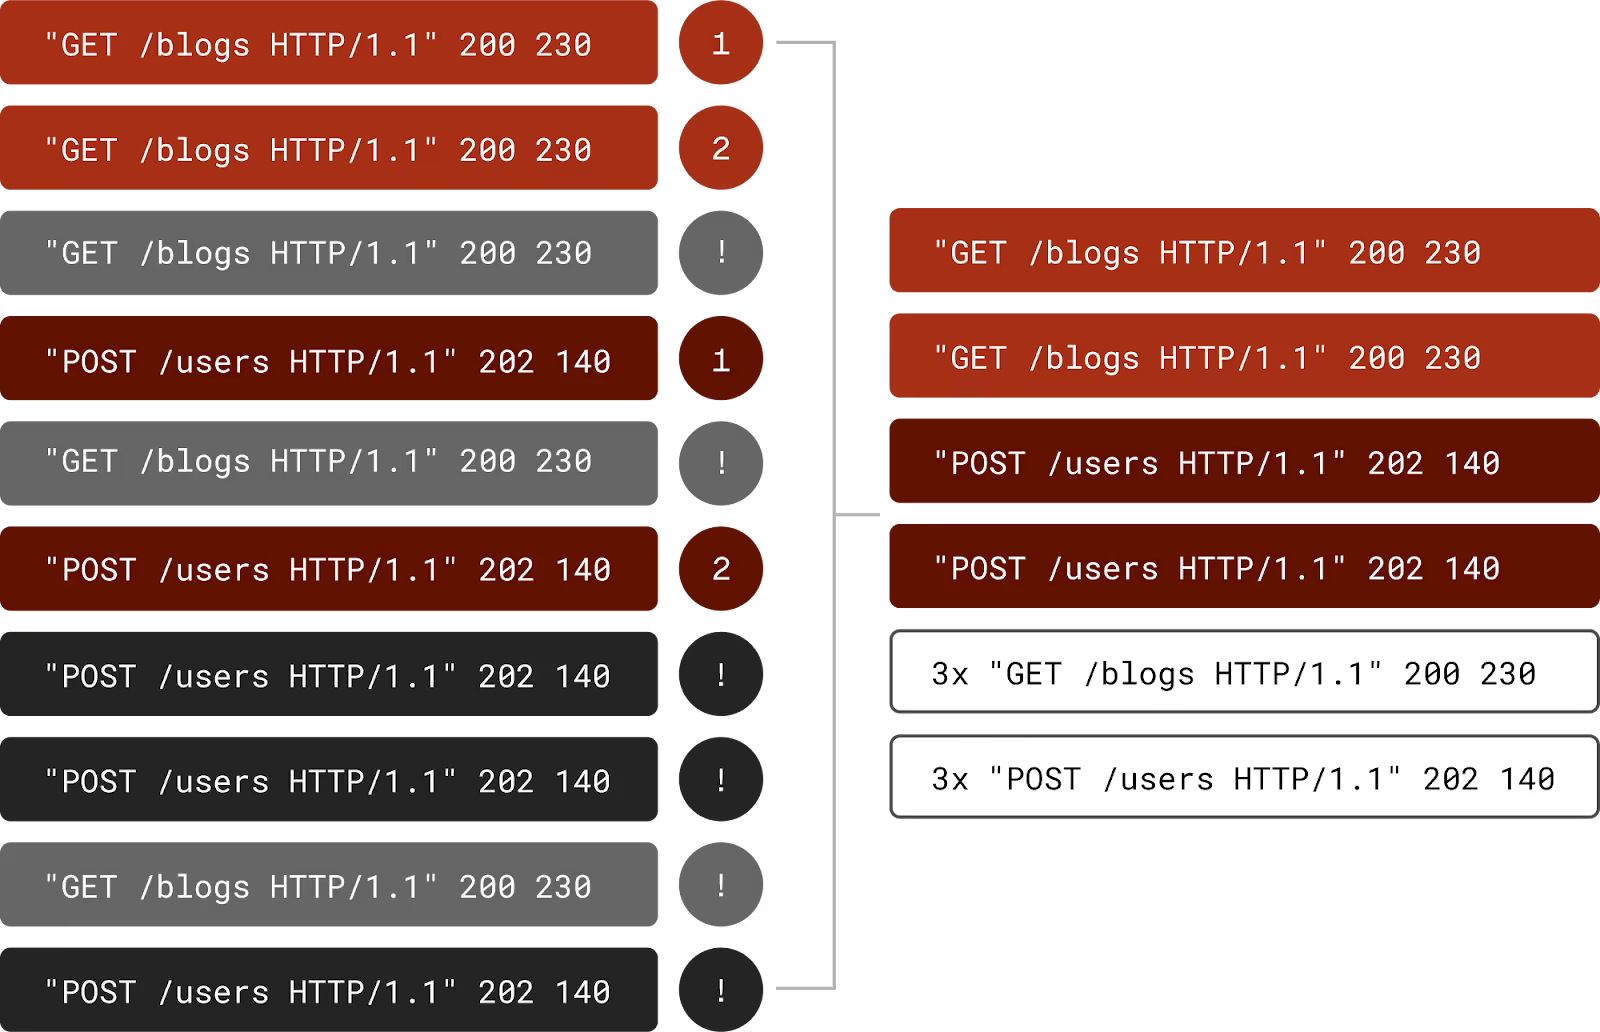
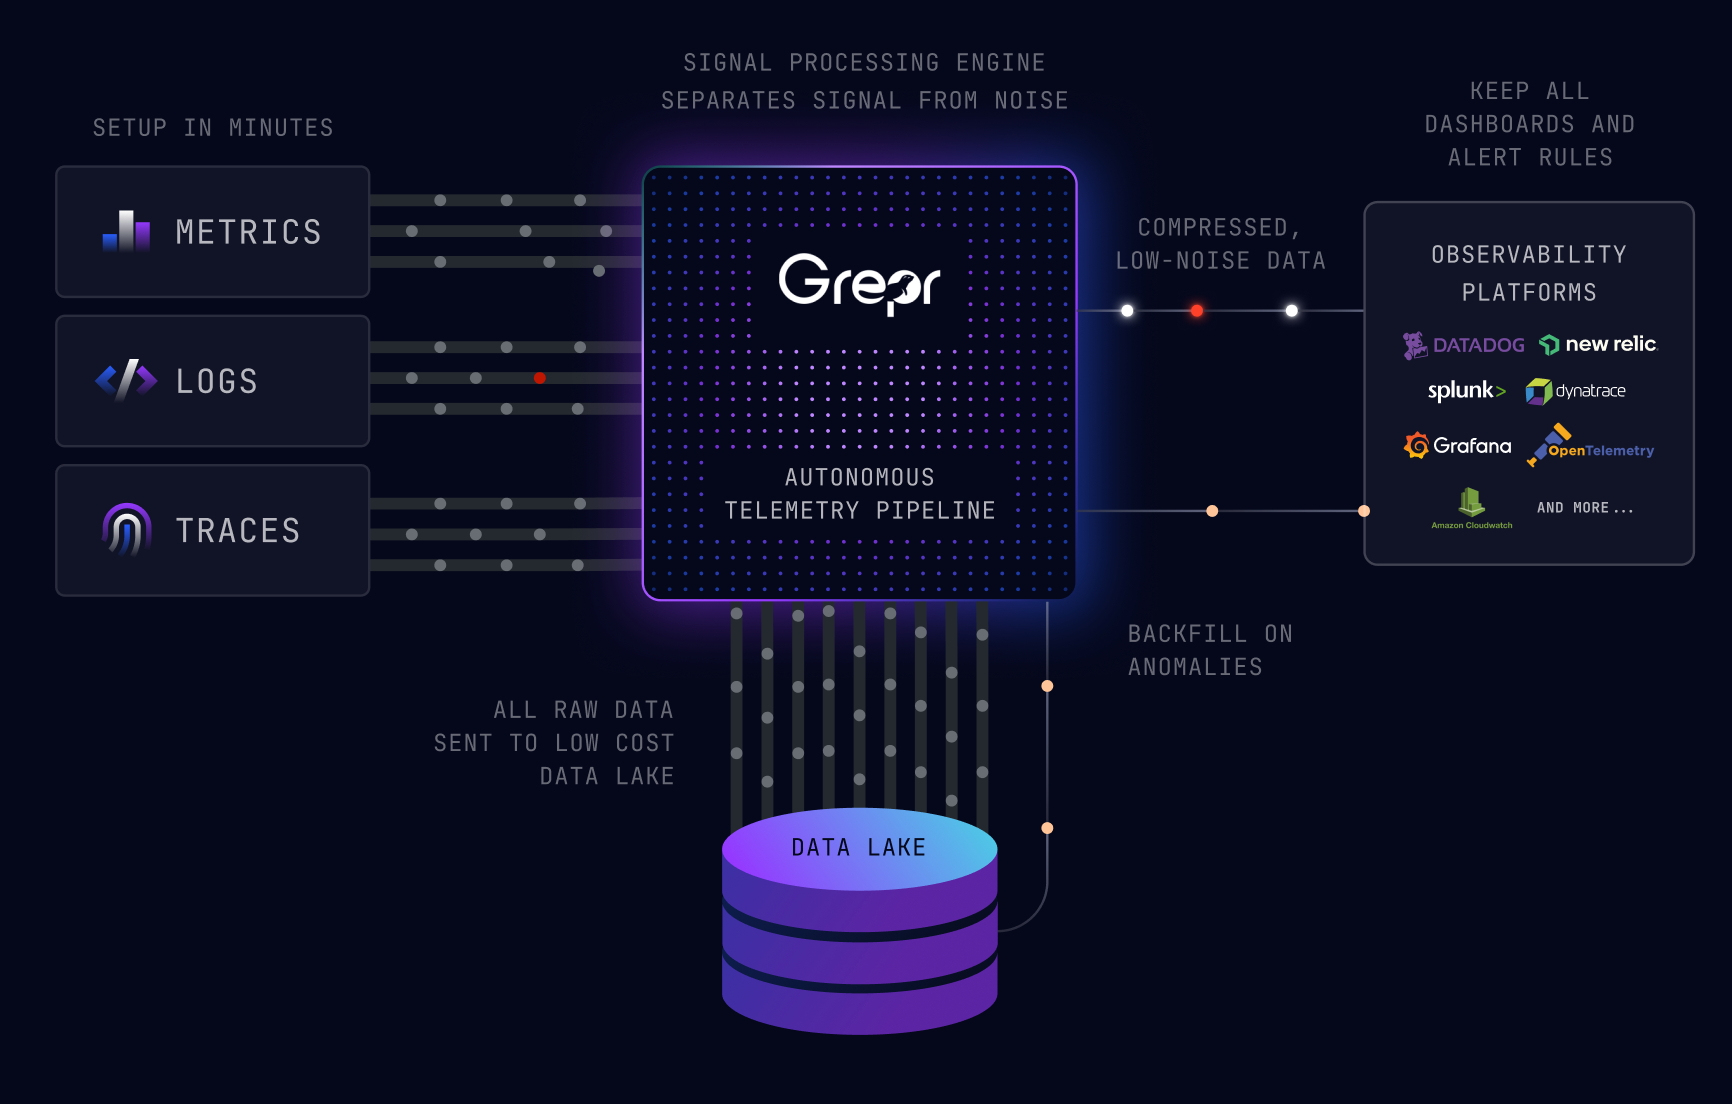
Grepr is easy to deploy when using Datadog as your observability platform. With a simple configuration change data is sent to Grepr instead of Datadog. Grepr uses AI to automatically detect similar patterns in the data, forwarding summaries for noisy data while passing unique messages straight through. This reduces data volume by 90% with a similar reduction in Datadog platform costs. No data is discarded, everything sent to Grepr is retained in low cost storage where it can be searched and optionally backfilled to Datadog.
The support for Datadog goes beyond just a data source and sink. The tight integration allows for automatic exception creation for any log entries used for Monitors and/or log derived metrics.
Integration
The first step is to create an integration between Grepr and Datadog, for this you will need a Datadog API Key and Application Key. Create these now or use existing ones. On the Grepr dashboard select Integration from the top menu then click the “Add New” button under “Observability Vendors”.

Make sure you select the correct site for the Datadog environment, this must match the site you log in to e.g. US1, US3, US5, EU1, etc. Paste in the API Key and Application Key from Datadog. This integration can now be used in pipelines.
Data Lake
All data sent to Grep is retained in low cost storage. Multiple data lakes can be used if you want to keep certain data separate from each other e.g. production and staging. Additionally multiple datasets can be defined inside each data lake e.g. security and application. Datasets can be used by multiple pipelines.

On the Grepr dashboard select Integrations from the top menu then under “Storage” click the “Add New” button.
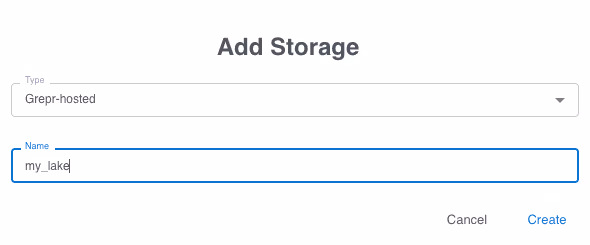
You use your own AWS S3 storage however for this example we will use the Grepr hosted storage. Once this is created, a dataset is created using this storage. On the Grepr dashboard select Datasets from the top menu then click the “Add New” button.

Give the dataset a name then select the storage you just created in the previous step.
Pipelines
Grepr does all its processing in a pipeline; multiple pipelines can be defined to support complex processing and routing of data across multiple sources and sinks. For this example, we’ll use just a single pipeline. On the Grepr dashboard select Home from the top menu then click the “Create Pipeline” button. Give the new pipeline a name.
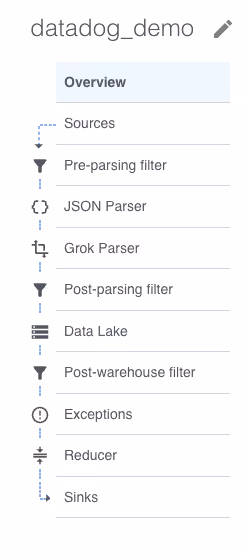
A new empty pipeline is created, the menu on the left shows the steps inside a pipeline. Don’t worry, most of those steps are optional. Starting at the top we will need a source, click on “Sources” then click the “Add” button.

Select the observability vendor integration you created in the first step, the name is automatically filled in. When the form is submitted the source is added to the pipeline and a matching sink is automatically added. A pipeline can have multiple sources and sinks however, for this example we will keep it simple with just a single source and sink. The same sources and sinks can be used in multiple pipelines.
Before the pipeline can be created it must have some storage configured. Select “Data Lake” from the steps on the left then click the “Add” button.
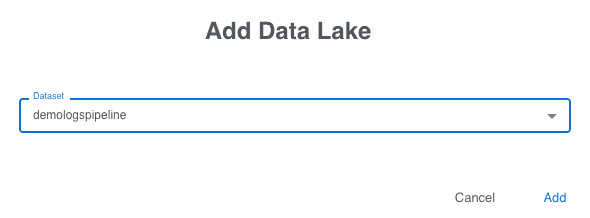
Select the dataset you previously created. A pipeline can store data to multiple datasets. You are now ready to create your first pipeline, click the “Create Pipeline” button at the top. It will take a few moments for the pipeline to be created and start running.
Datadog Agent Configuration
Now that the pipeline is running it’s ready to receive data. On the Grepr dashboard click on details for your pipeline.

Now select Sources from the left.
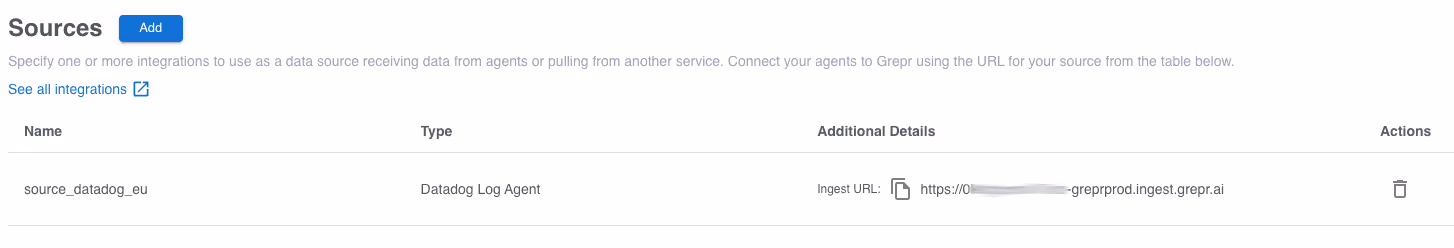
The ingest URL is shown on the right, click the copy icon to copy the URL to the clipboard, you will need this later. Below is the configuration for starting the Datadog agent in a Docker container to sent the data to Grepr instead of Datadog.

The changes required are the extra configuration items:
- DD_LOGS_CONFIG_LOGS_DD_URL
- DD_LOGS_CONFIG_USE_HTTP
Once the configuration changes have been made and the agent restarted, the data will start to flow through Grepr on its way to Datadog.
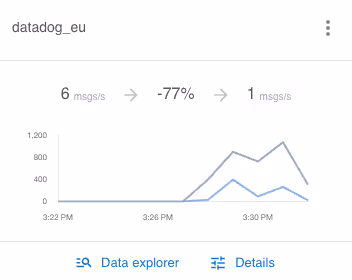
From a cold start Grepr is already reducing the log volume by 77%, this will only improve the longer it runs because the AI will continually tune the active set of filters. Looking at the logs now coming into Datadog you can see the summaries of the log messages.

Monitors And Log Derived Metrics
If you have defined log monitors and/or log derived metrics, the summarisation of the logs may skew those values. There are two approaches to mitigate this. The Datadog expression can be enhanced to use the attribute value “grepr.repeatCount” which will now be present on all entries whether they are summarised or not. The log entries used for those monitors and metrics can be added to the exception list in the pipeline. The tight integration between Grepr and Datadog provides a prepopulated list of these. On the Grepr dashboard go to the details of your pipeline then select “Exceptions” from the left and click the “Add” button.
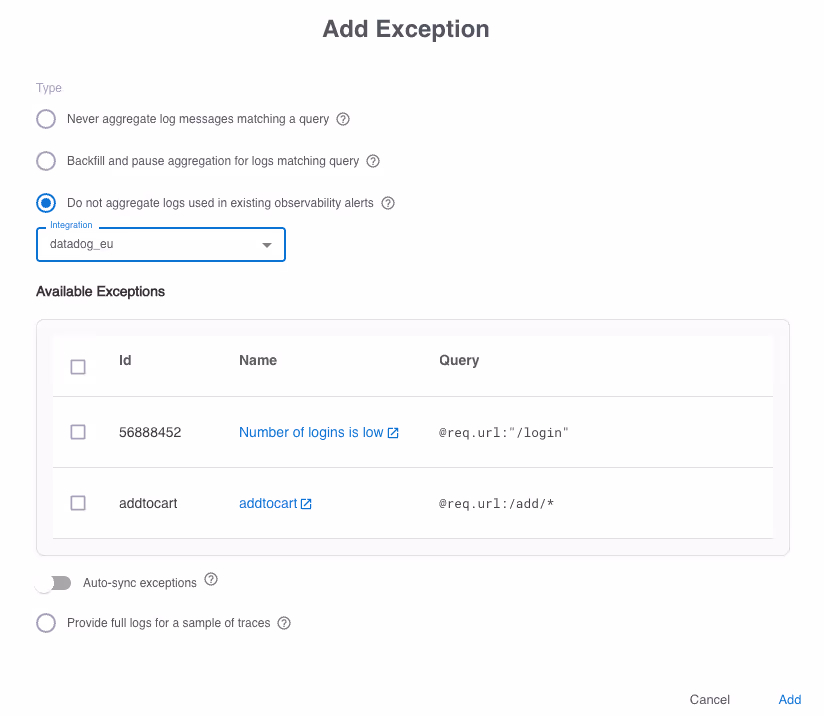
Now choose which ones you would like to be added to the exceptions list. Enabling “Auto-sync exceptions” causes any new monitors or metrics added in Datadog to also be automatically added to the exception list.
Try Grepr For Free
With just a few minutes work across a handful of steps you will soon have the power of Grepr’s AI reducing the log volume by 90% while retaining 100% insight into your applications. Why not give it a try yourself? Sign up for a free trial today.
More blog posts
All blog posts
How Envoy Reduced Observability Data Volume by 90% Without Touching a Single Dashboard
Grepr Just Launched a Free Tier: Reduce telemetry noise by 90%

Grepr Wins the 2026 Intellyx Digital Innovator Award for Observability Cost Reduction
Get started free and see Grepr in action in 30 minutes.
