Product Features
How Grepr Cuts Log Volume by 90% Using a Semantic Pipeline

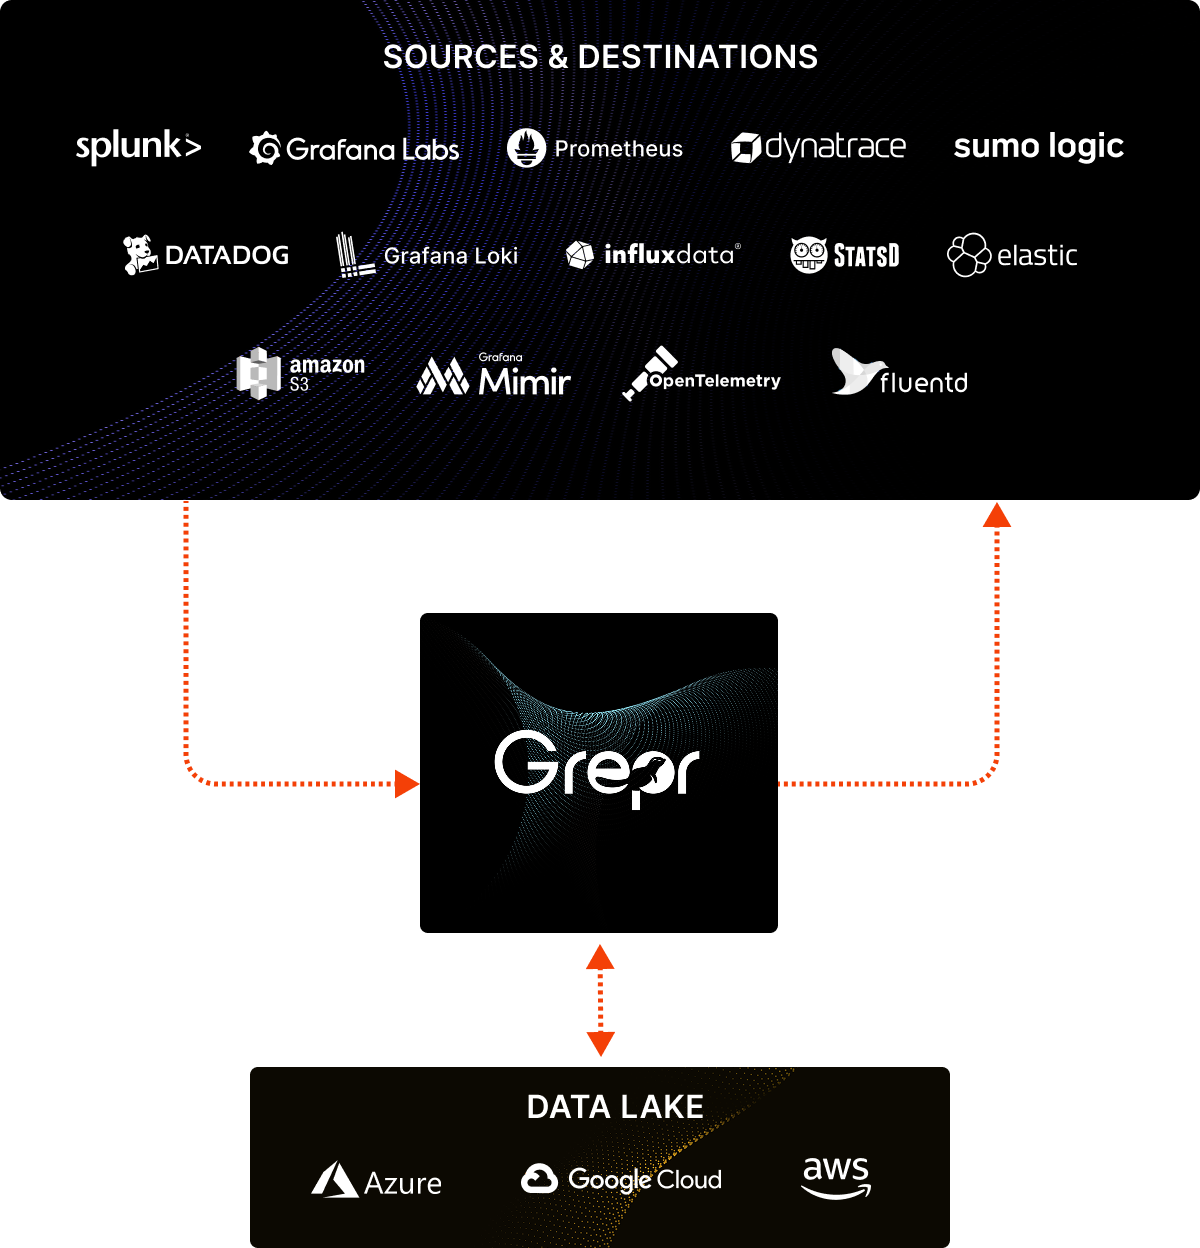
Grepr slips in like a shim between the log shippers and the aggregation backend. With a small configuration change log shippers forward the logs to Grepr instead of the usual aggregation backend. Grepr automatically analyses each log entry and identifies similarity across all messages in real time. Noisy messages are summarised while unique messages are passed straight through. Nothing is discarded, all messages received by Grepr are persisted in low cost storage.
As the log messages arrive in Grepr they are processed by a pipeline which parses the messages into the Grepr internal structure. Each log message has the following structure:
Once the message is in a standard form the real work can begin. Masking automatically identifies and masks out frequently changing values such as numbers, UUID, timestamps, IP addresses, etc. This significantly improves the efficiency od our machine learning by normalising variable data into consistent patterns.
Using sophisticated similarity metrics to group messages into patterns. The similarity threshold determines how closely messages must match to be considered part of the same pattern.
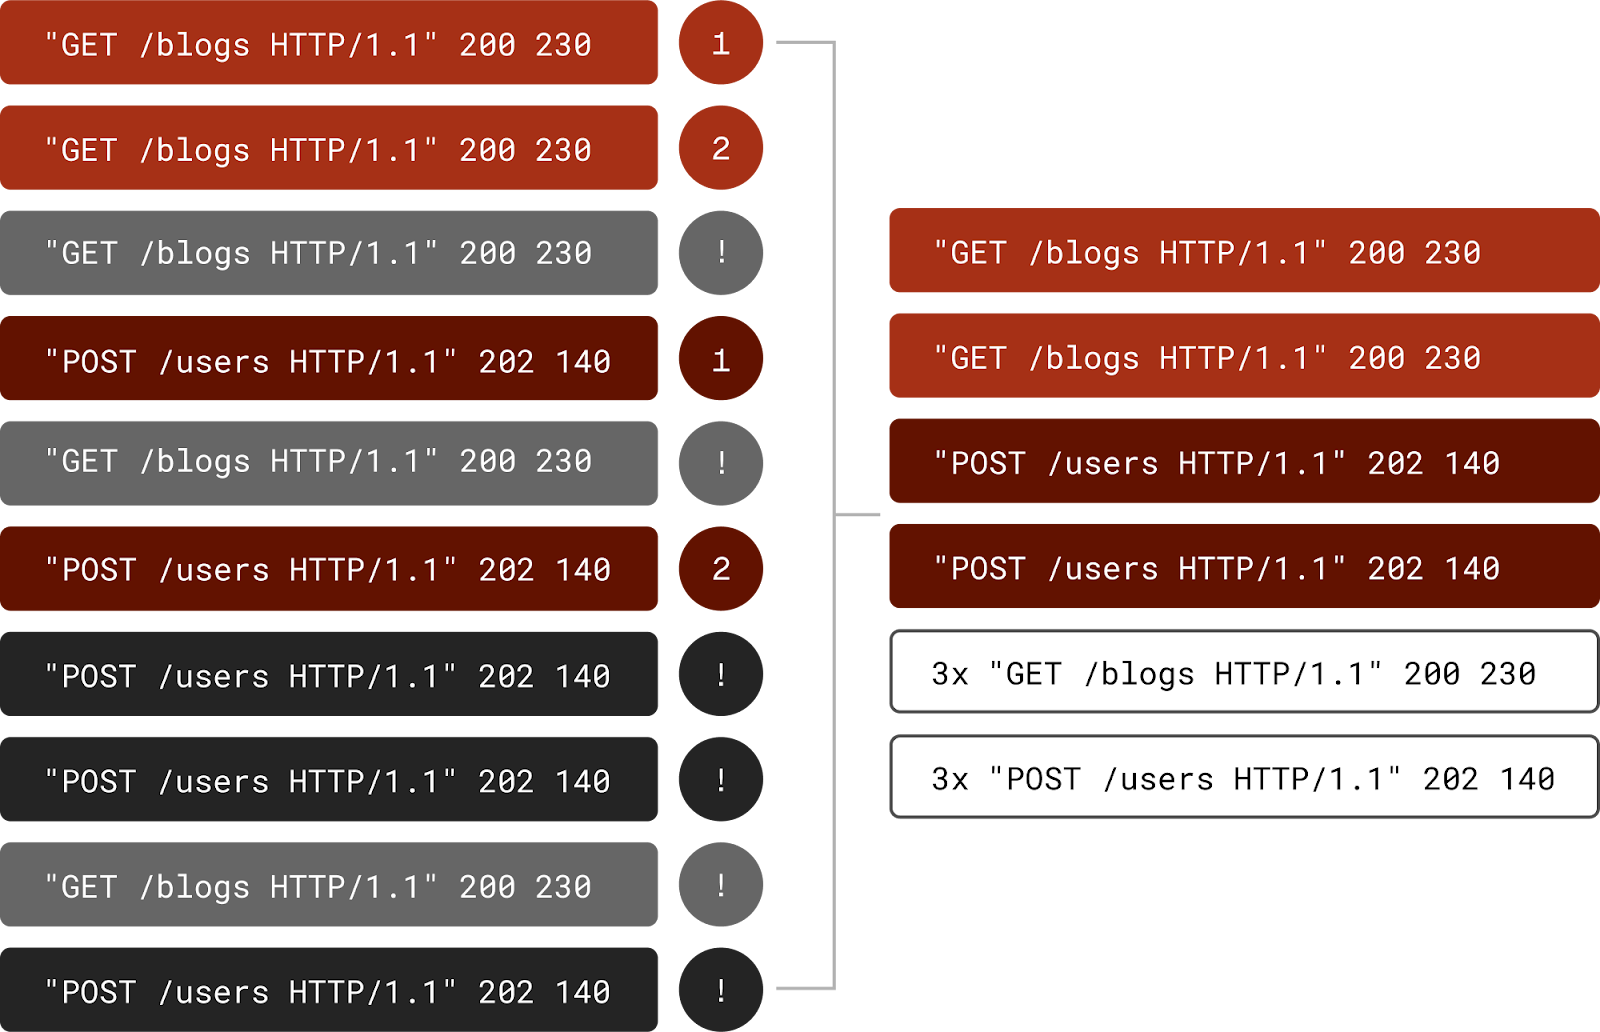
Once a pattern reaches a threshold, Grepr will either stop forwarding those messages matching the pattern or only forward a sampled subset of the matching messages. If the pattern has been configured to be sampled, then Grepr uses a logarithmic sampling algorithm. With the base set to 2 and the deduplication threshold set to 4, then Grepr will send an additional sample message once the number of messages reaches 32. Since 4 messages were already sent before the threshold was reached and 2^4 = 16 so the next threshold is 32 and 64, 128, 256, you get the idea.
At the end of each time slot, Grepr will generate a concise summary for each clustered pattern including the following extra attributes:
The machine learning in the semantic pipeline does a very good job of significantly reducing the volume of log data sent through to the aggregation backend without filtering out any essential data. However, there are always exceptions. Fortunately there is a rules engine that works beside the machine learning that allows for the configuration and fine tuning of which messages are filtered and which are allowed to pass straight through.
When using Grepr to automatically manage log data, it’s like having an engineer look at each message and decide which ones are useful and which ones may not be useful. Most log messages are only useful when investigating an issue, only a small subset of messages are useful to verify that everything is working as it should be. Why pay to have every message indexed and stored by your log aggregation backend? With Grepr you can keep all messages in low cost storage where they can be queried for reporting or to feed AI analysis. When an incident occurs, the relevant log messages can be quickly backfilled into the log aggregation backend to aid in the restoration of service. With this strategy, you get the benefits of automated log reduction without changing any of the configurations, analytics or dashboarding your team has built on the logging tools.