
.avif)
What is Vector?
Vector is an open source, high performance observability data pipeline sponsored by Datadog. It collects, transforms, and routes data from multiple sources to multiple sinks.
Vector is built with Rust, which compiles to a single binary for easy installation. Configuration uses YAML, TOML, or JSON files, with additional processing available through Vector Remap Language (VRL) and Lua.
What is Grepr?
Grepr is an intelligent observability pipeline that orchestrates data between infrastructure, applications, and observability vendors. Grepr deploys between your agents and observability platform, automatically transforming, aggregating, analyzing, and routing your observability data.
Grepr customers use the platform to:
- Slash observability costs by 90%
- Store data long-term
- Unlock observability data for business reporting and AI
Grepr is typically provided as SaaS but can be deployed on your own infrastructure, whether physical or virtual.
Automatic vs Manual Configuration
At a superficial level, both products appear similar. They both route data between sources and sinks with transformation along the way. However, there are significant differences in how each is configured and the effort required.
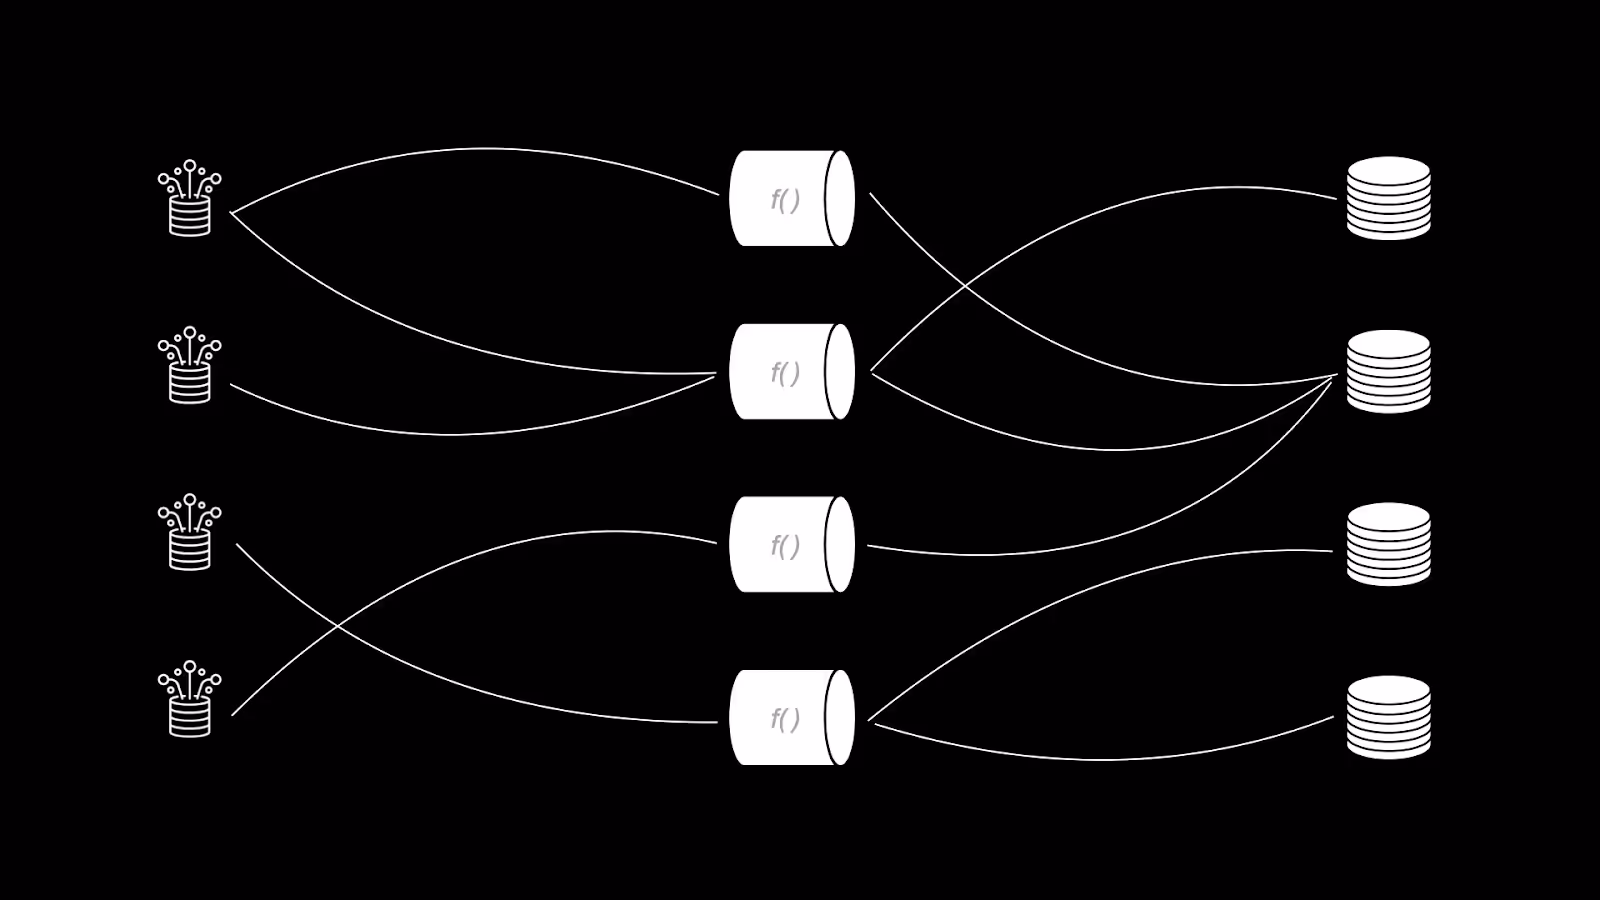
Vector's Approach
Vector is a swiss army knife with multitudinous sources and sinks, together with a multiplicity of transforms including support for a couple of programming languages. You could say it's the tool that has it all.
However, as a result of this profusion of options, configuration is non-trivial and requires considerable skill together with learning yet another domain specific language (VRL).
Production deployment also requires some consideration, as it will need multiple installs together with highly available load balancers. This tends to limit protocols to HTTP only. Splunk S2S protocol is not HTTP based and currently not supported by Vector.
Although AWS S3 is supported as a sink, the data is written as batched compressed files, meaning the contents cannot be queried.
Grepr's Approach
Grepr currently supports the usual suspects for sources and sinks, with more being added in the future. Rather than provide a multitude of transforms that have to be manually configured, Grepr uses machine learning (AI) to analyze the semantics of the observability data.

Grepr dynamically manages a collection of transforms to reduce the volume of data by 90%. Typically there are 179,000 dynamically created transforms running with a large dataset. Imagine the effort required to do that manually.
No data is dropped. All data sent to Grepr is retained in low cost storage, typically AWS S3. With Grepr, the data in AWS S3 is written using Apache Iceberg Parquet, which means that the data can be queried.
The best part is that there is not yet another domain specific language for this. The data can be queried using Datadog, Splunk, and New Relic languages, with others to be added in the future.
The results of a query performed against the AWS S3 data can optionally be submitted as a backfill job. Those matching entries will be sent through to the configured sinks, filling in the summary information to provide a rich data set in the tool your engineers use everyday.
Buy vs Build
You burn copious days configuring and programming Vector, then deploying a highly available cluster with load balancers. Even after all that effort, it would still not have anywhere near the level of automation that Grepr has. Additionally, it would still be just a static configuration and would not adapt to any changes in the datastream, for example a change in the log format used for Nginx or the deployment of a new data store.
Alternatively, you should just use Grepr. The SaaS platform is highly available and SOC 2 certified. In just 20 minutes you could have your first pipeline deployed and start saving on your observability platform costs. The dynamic nature of the Grepr AI means that any changes in the datastream are automatically handled.
Frequently Asked Questions
What is the main difference between Vector and Grepr?
Vector requires manual configuration using YAML, TOML, or JSON files along with Vector Remap Language (VRL). Grepr uses machine learning to automatically analyze and optimize your observability data, dynamically creating and managing transforms without manual intervention.
How much can Grepr reduce observability costs?
Grepr customers typically reduce their observability costs by 90% through intelligent data aggregation and transformation that reduces data volume while retaining all original data in low-cost storage.
Does Grepr drop any observability data?
No. All data sent to Grepr is retained in low-cost storage (typically AWS S3) using Apache Iceberg Parquet format. This data remains queryable using Datadog, Splunk, or New Relic query languages.
What protocols does Vector support compared to Grepr?
Vector's load balancer requirements tend to limit it to HTTP-based protocols. Splunk S2S protocol, which is not HTTP based, is currently not supported by Vector. Grepr supports common observability protocols with more being added continuously.
How long does it take to deploy Grepr versus Vector?
Vector requires significant time for configuration, programming, and deploying a highly available cluster with load balancers. Grepr can have your first pipeline deployed in just 20 minutes as a SOC 2 certified SaaS platform.
More blog posts
All blog posts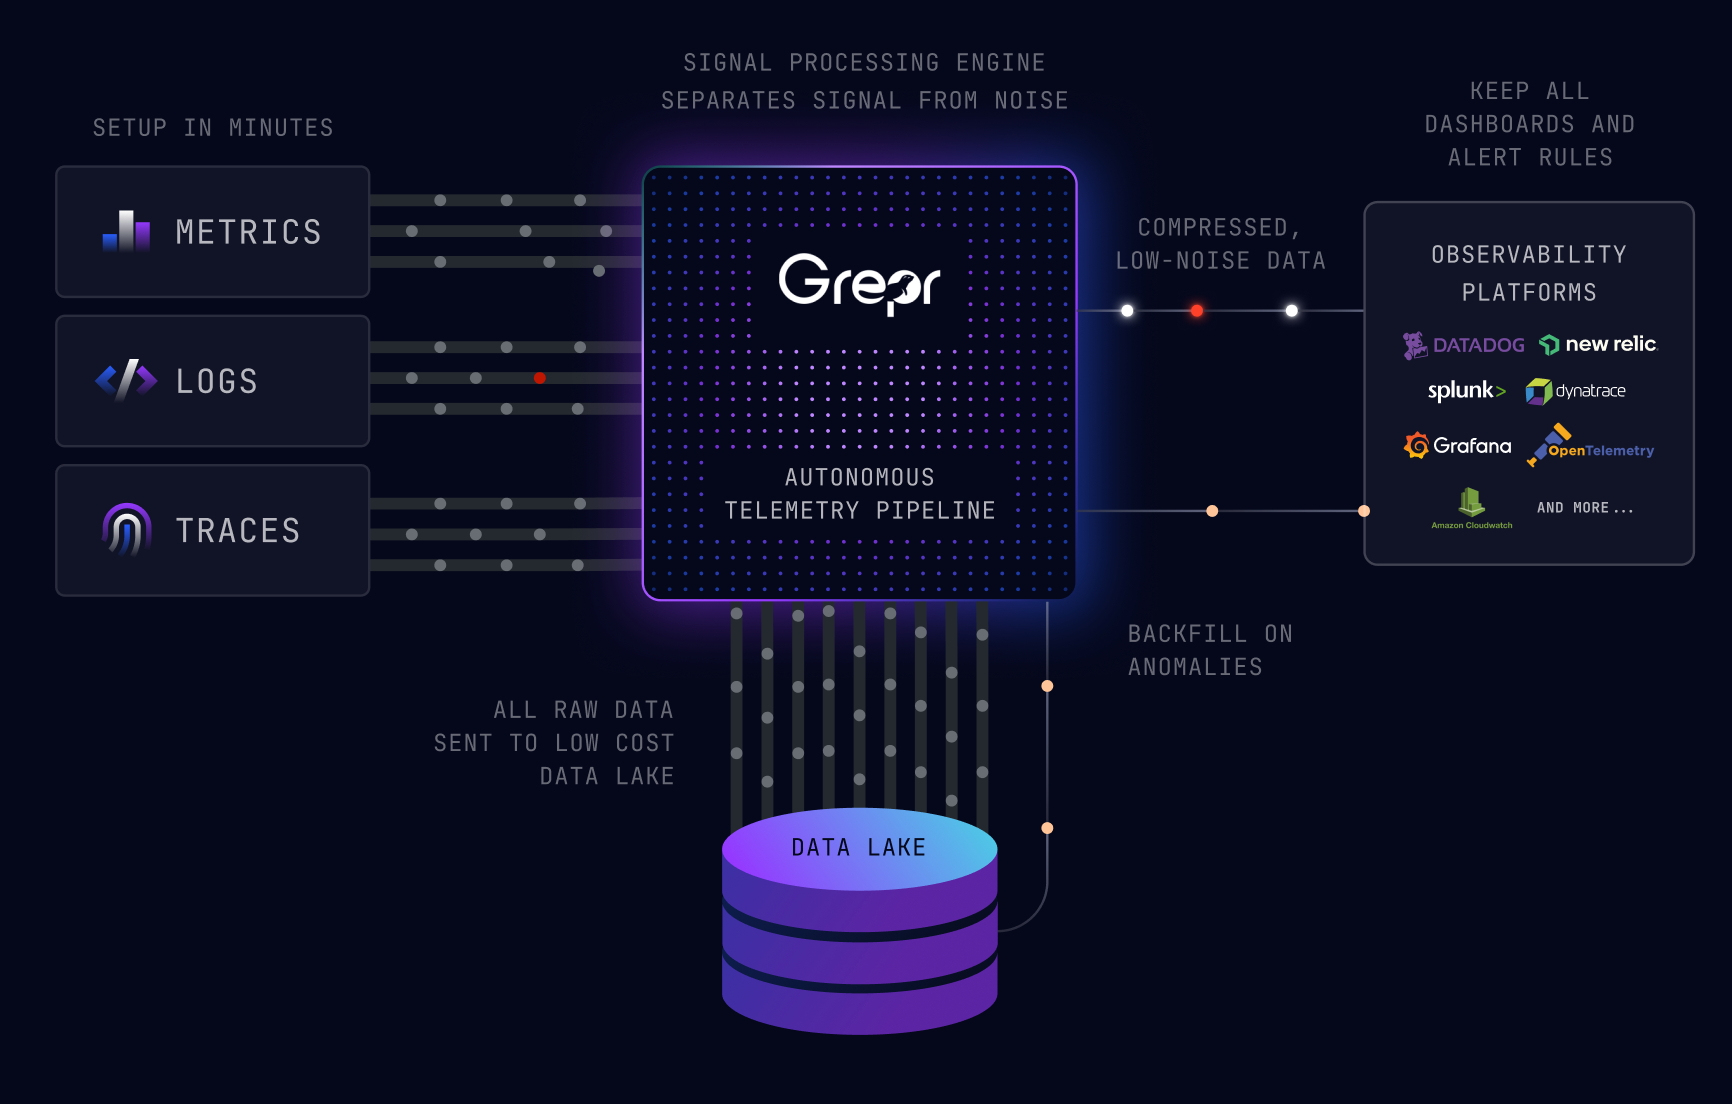
Grepr Just Launched a Free Tier: Reduce telemetry noise by 90%

Grepr Wins the 2026 Intellyx Digital Innovator Award for Observability Cost Reduction

What We Heard at Observability Summit 2026
Get started free and see Grepr in action in 30 minutes.
