

The complexity of the Grepr Intelligent Observability Data Engine is hidden behind an easy to use web dashboard and simple to implement integrations with common log shippers. Here we take a peek inside the inner workings of Grepr.
The name Grepr may imply to some that the inner workings of Grepr is just a collection of regular expressions, in fact it’s a lot more complicated than that and it does not involve grep at all.
Pipelines

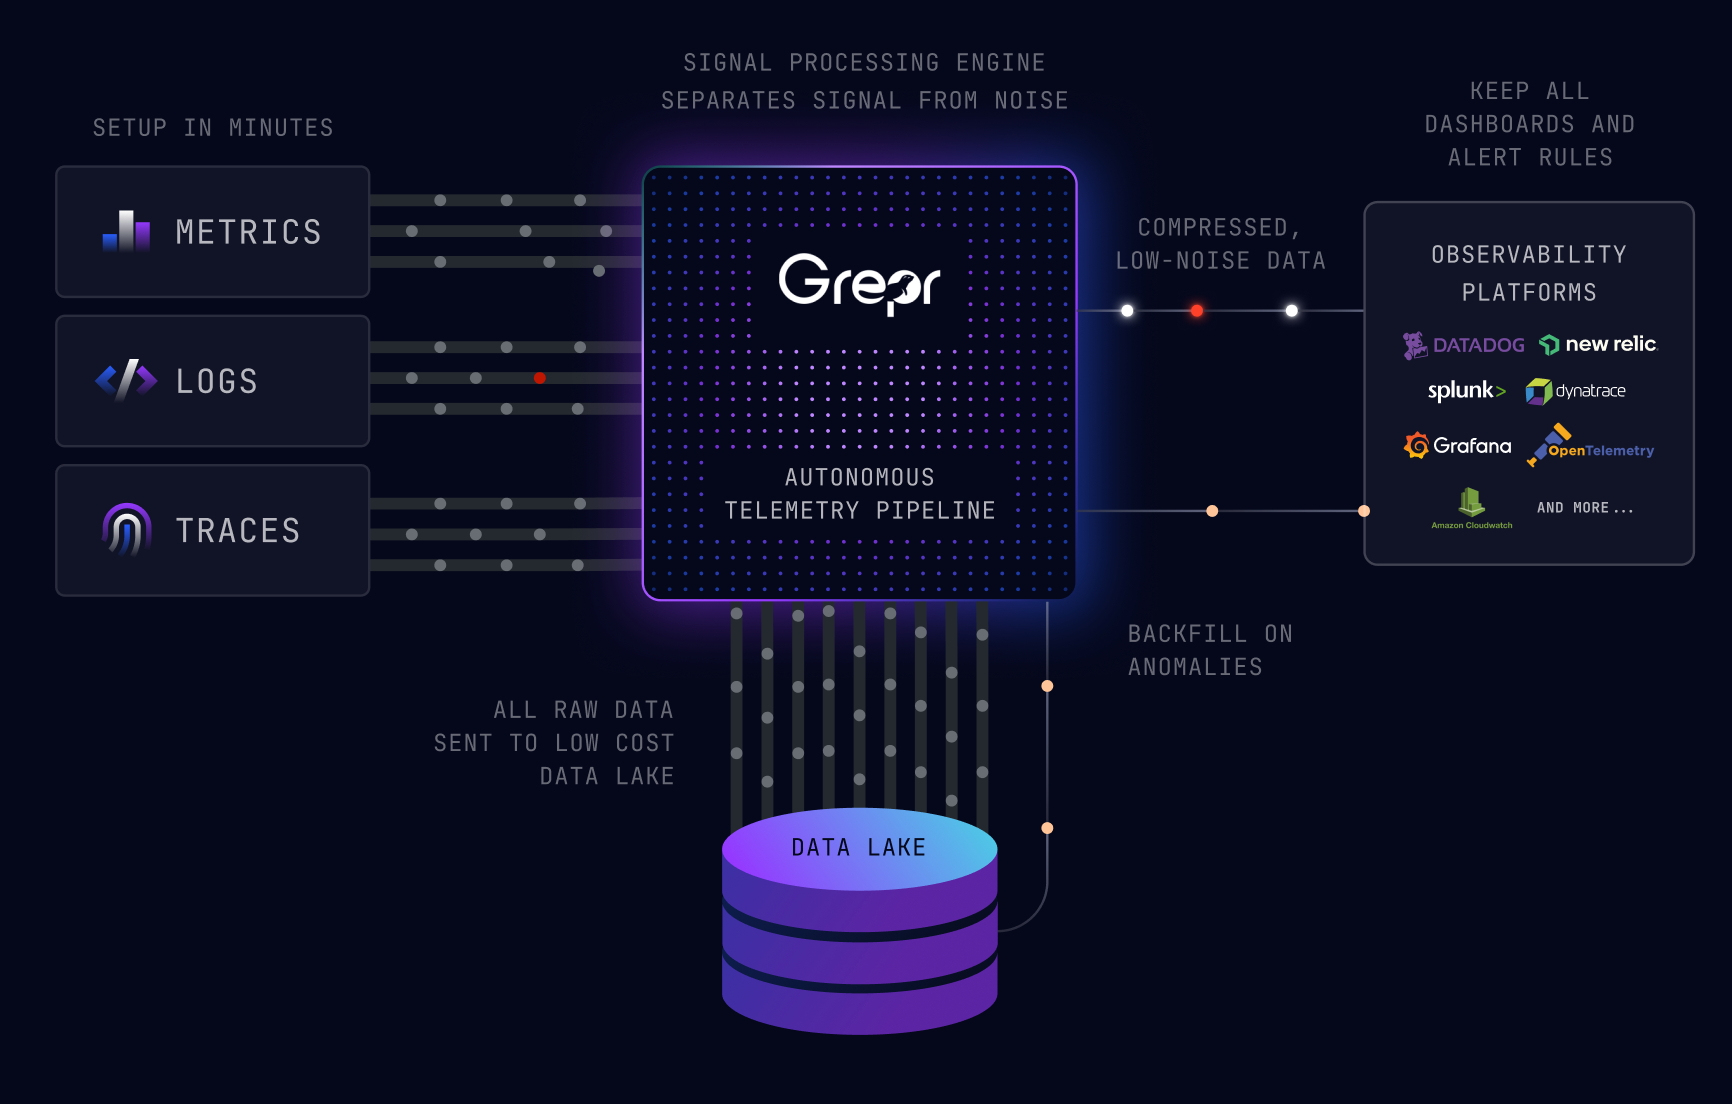
Pipelines are the beating heart of Grepr, they read data from one or more sources, store it in one or more datasets, process it and finally write it out to one or more sinks.
Sources
These are endpoints for the log shippers to send data to instead of the usual destinations such as: Splunk, Datadog, New Relic. The Grepr endpoint will be indistinguishable from the regular endpoint that the log shipper is usually configured to send data to.
Datasets
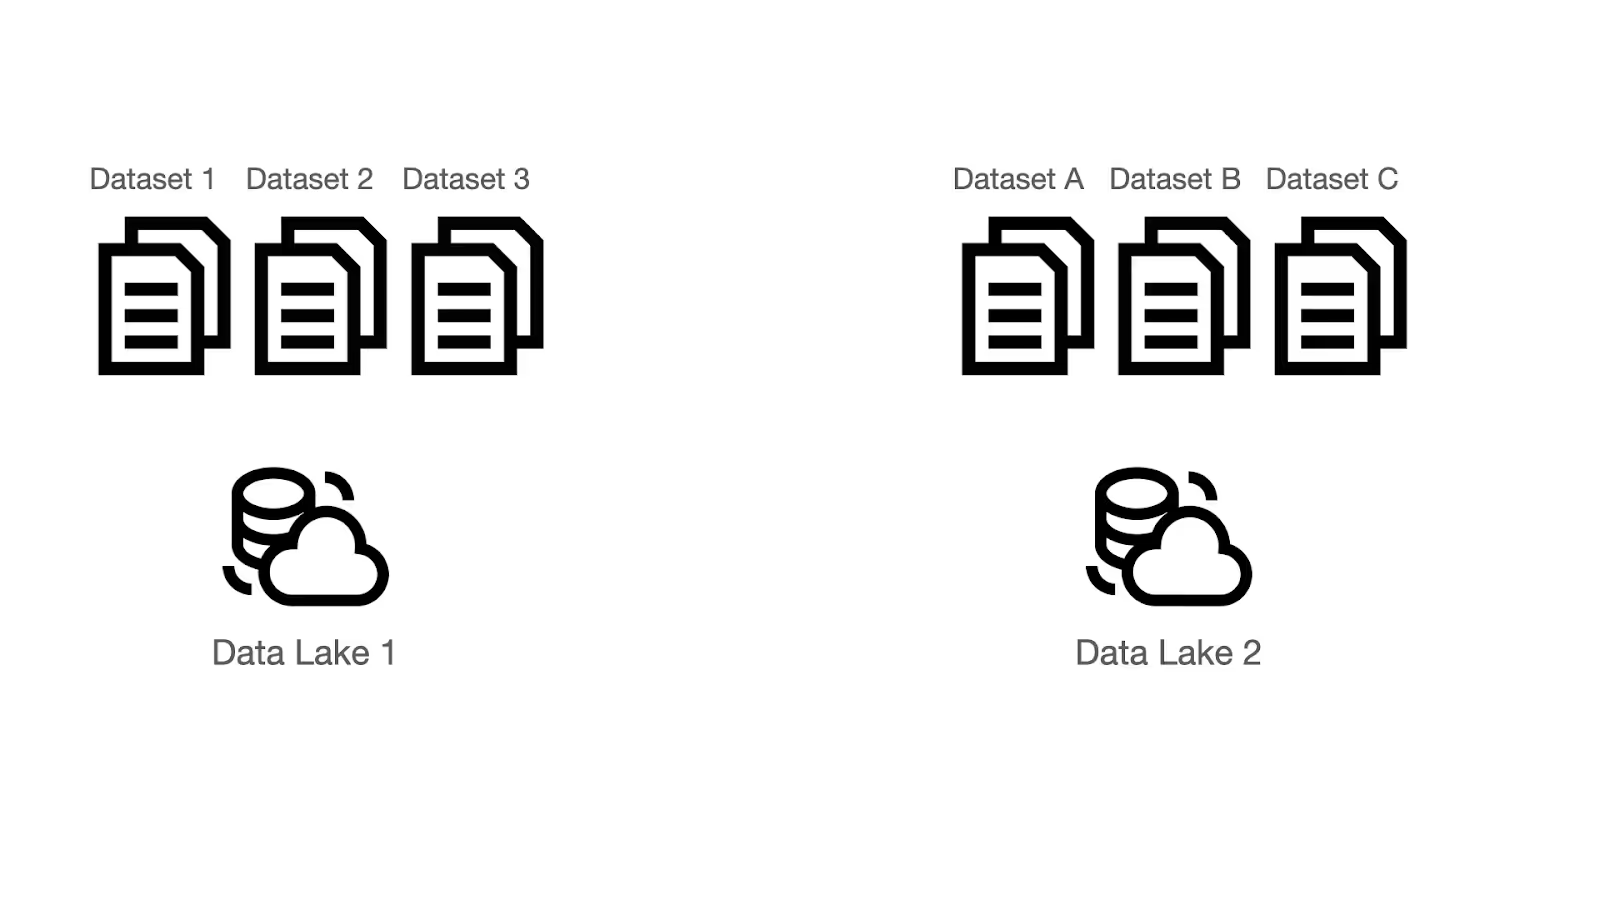
All data sent to Grepr is retained in low cost storage either Grepr hosted S3 buckets or your own. Each S3 bucket aka Data Lake may contain one or more datasets, for example a bucket could contain datasets for production and staging. One or more pipelines can utilize a dataset.
Sinks
After Grepr has processed the data the summary entries for the verbose data and the unique entries are written out to the regular log aggregation and storage backend: Splunk, Datadog, New Relic.
Processing

Grepr supports both structured and unstructured log data. Each log message is parsed into an internal record:
- Id - A globally unique identifier for this event
- receivedTimestamp - The point in time that Grepr received the event
- eventTimestamp - The point in time that the event occurred
- Tags - A set of key - value pairs extracted from the event e.g. host, service
- Attributes - A set of key - value pairs extracted from the message
- Message - The message itself
- Severity - Extracted from the event: 1-4 TRACE, 5-8 DEBUG, 9-12 INFO, 13-16 WARN, 17-20 ERROR, 21-24 FATAL.
{
  "type": "log",
  "id": "0mdj5j8wz06yx",
  "receivedTimestamp": 1753277608167,
  "eventTimestamp": 1753277604321,
  "tags": {
    "image_name": "steveww/rs-cart",
    "container_name": "robot-shop-cart-1",
    "service": "rs-cart",
    "short_image": "rs-cart",
    "host": "957bdcf3dcf4",
    "source": "rs-cart",
    "image_tag": "1.0.13",
    "image_id": "sha256:6695ca1ed437db0548356b179026341a632e52f569ebb413b33697b27fcd208b",
    "container_id": "957bdcf3dcf4c5b98e980b17a9d4a7a13c98ee7bdc4ce0b45c9ab76c4b3eac90",
    "docker_image": "steveww/rs-cart:1.0.13"
  },
  "attributes": {
    "hostname": "957bdcf3dcf4",
    "req": {
      "headers": {
        "host": "localhost:8080",
        "user-agent": "curl/7.64.0",
        "accept": "*/*"
      },
      "method": "GET",
      "query": {},
      "remotePort": 56128,
      "id": 3,
      "params": {},
      "url": "/health",
      "remoteAddress": "::1"
    },
    "time": 1753277546571,
    "responseTime": 2,
    "meta.grepr.messageAttributePath": "msg",
    "pid": 1,
    "level": "info",
    "res": {
      "headers": {
        "access-control-allow-origin": "*",
        "content-length": "25",
        "x-powered-by": "Express",
        "content-type": "application/json; charset=utf-8",
        "etag": "W/\"19-PNgogu5NtxY46N+WhTPw15zgIXM\"",
        "timing-allow-origin": "*"
      },
      "statusCode": 200
    },
    "status": "info"
  },
  "message": "request completed",
  "severity": 9
}
Now that all the messages are internally represented in a common format, they can be analysed and reduced by the following key steps:
- Masking - Automatically identifies and masks frequently changing values such as numbers, UUID, timestamps and IP addresses. Normalises data into consistent patterns.
- Tokenizing - Breaks log messages down into semantic tokens based on punctuation characters; lexical analysis.
- Clustering - Using machine learning to group messages based on similarity patterns. A high volume data stream of messages can have hundreds of thousands of similarity patterns under analysis.
- Sampling - Once a pattern under analysis reaches the threshold, no more matching messages are passed through.
- Summarising - At the end of the time window a summary for each pattern is forwarded with extra tags added: grepr.patternId, prepr.rawLogsUrl, grepr.repeatCount.
Just like a real engine, you can tune the performance of the Grepr Data Engine.
- Aggregation Time Window - The time interval for the production of summarisation.
- Exception Rules - Specify which messages should not be reduced and just passed straight through.
- Similarity Threshold - How close the pattern has to match before a message is considered similar.
- Deduplication & Sampling Strategy
- Attribute Aggregation
Deduplication And Sampling
Every aggregation window, Grepr will start by passing through a configurable number of sample messages unaggregated for each pattern. Once that threshold is crossed for a specific pattern, Grepr by default stops sending messages for that pattern until the end of the aggregation window. Then the life cycle repeats. This ensures that a base minimum number of raw messages will always pass through unaggregated. Low frequency messages that usually contain important troubleshooting information will pass through unaggregated.
While this behavior maximizes the reduction, log spikes for any messages beyond the deduplication threshold disappear. Features in the external log aggregator that depend on counts of messages by pattern (such as Datadog's "group by pattern" capability) would no longer work well.
Instead, Grepr allows users to sample messages beyond the deduplication threshold. Grepr implements "Logarithmic Sampling" that allows noisier patterns to be sampled more heavily than less noisy patterns within the aggregation window. To enable this capability, you configure the logarithm base for the sampler. If the base is set to 2 and the deduplication threshold is set to 4, then Grepr will send one additional sample message once the number of messages hits 32 within the aggregation window (since we already sent 4 before the deduplication threshold is hit, and 2^4 = 16) another at 64, at 128, etc.
Attribute Aggregation
Provides fine level control over how the attributes section of a message are combined when messages are aggregated into a single pattern. The message text may be similar enough for aggregation but the attributes can vary. There are two ways to configure how attributes are handled.
Specific Attribute Path Strategies - Using a selector for the attribute path a merge strategy can be specified: Exact match, preserve all, sample.
Default Attribute Merge Strategy - For any attribute keys not specifically specified, use the selected strategy: Exact match, preserve all, sample.
For the complete reference see the documentation.
Dynamic Rule Engine
Even with a low-volume data stream of 300 messages per second Grepr reduces log volume by 90%. Internally it will be managing a live pattern rule set in the region of 200,000 patterns which are continually adapted to the incoming stream. It is simply not possible to achieve this level of sophistication and data reduction with a manually managed set of pattern matches. The Grepr Dynamic Data Engine does all the work for you resulting in significant savings on log aggregation and storage costs.
More blog posts
All blog posts
How Envoy Reduced Observability Data Volume by 90% Without Touching a Single Dashboard
Grepr Just Launched a Free Tier: Reduce telemetry noise by 90%

Grepr Wins the 2026 Intellyx Digital Innovator Award for Observability Cost Reduction
Get started free and see Grepr in action in 30 minutes.
