Product Features
Use Grepr With Splunk

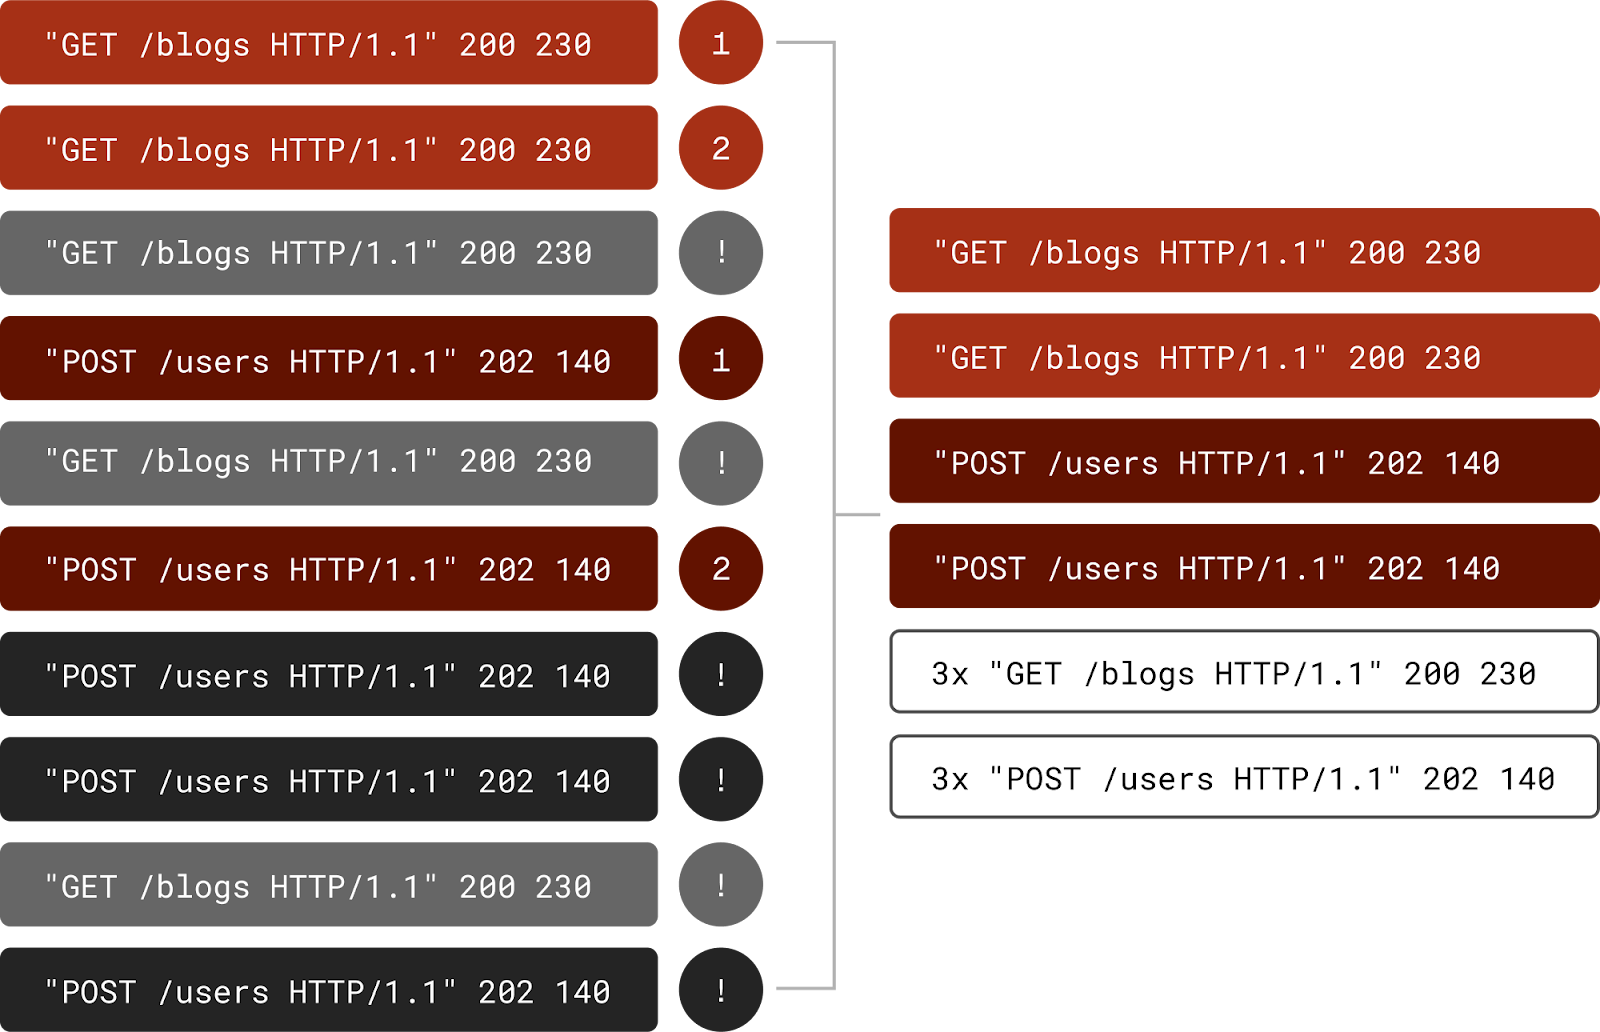
Grepr is easy to deploy when using Splunk as your log aggregation platform. With a simple configuration change, logs are sent to Grepr instead of Splunk. Grepr uses Machine Learning to automatically detect similar patterns in the logs, forwarding summaries for frequent messages while passing unique messages straight through. This reduces log volume by 90% with a similar reduction in Splunk Cloud costs. No log entries are discarded, everything sent to Grepr is retained in low-cost storage where it can be searched and optionally backfilled to Splunk.
Grepr has the unique capability to work with both Splunk S2S and HTTP Event Collector (HEC). Some log shippers that can use HEC include:
To start you need to set up a HEC data input and save its access token. On the Splunk web dashboard go to Settings -> Data Inputs.
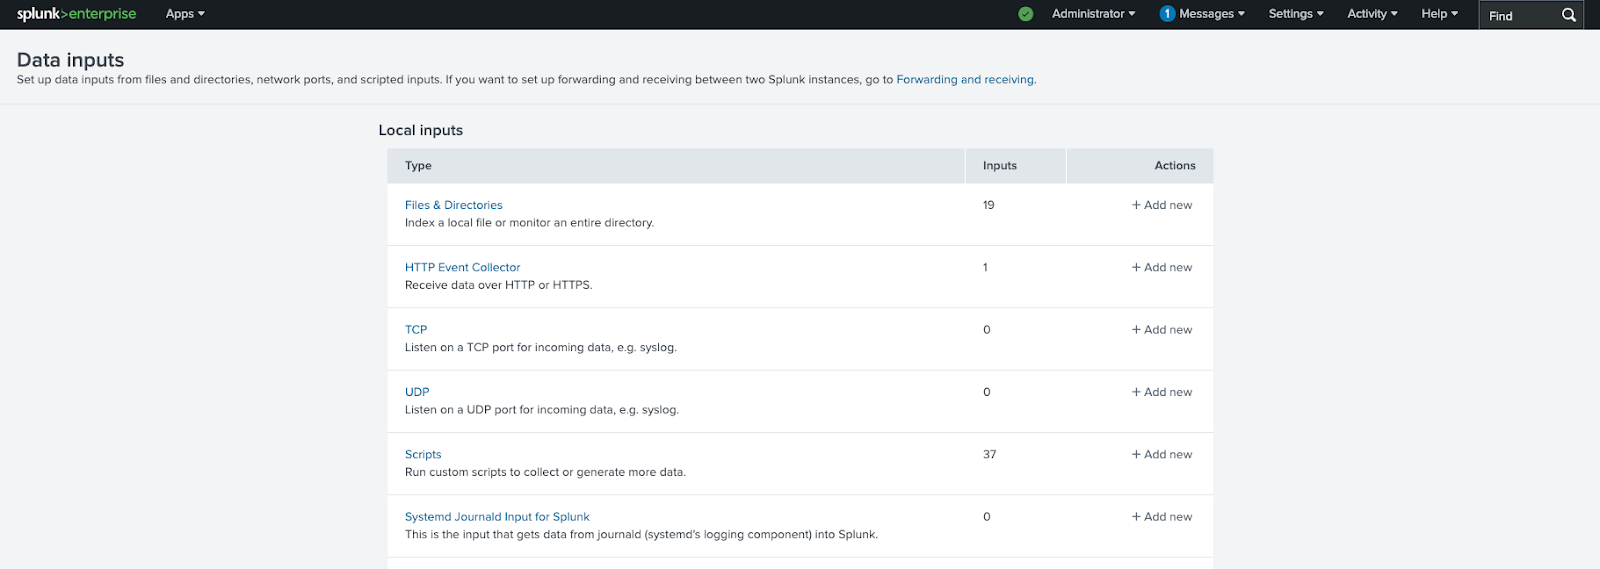
Either use an existing input or select “Add new”. Give the new collector a name and select the indexes it will use. Once the new input has been created it will display the token, save this, you will need it later. If using an existing input, you can reveal the token.
On the Grepr dashboard select Integration from the top menu then click the “Add New” button under “Observability Vendors”.
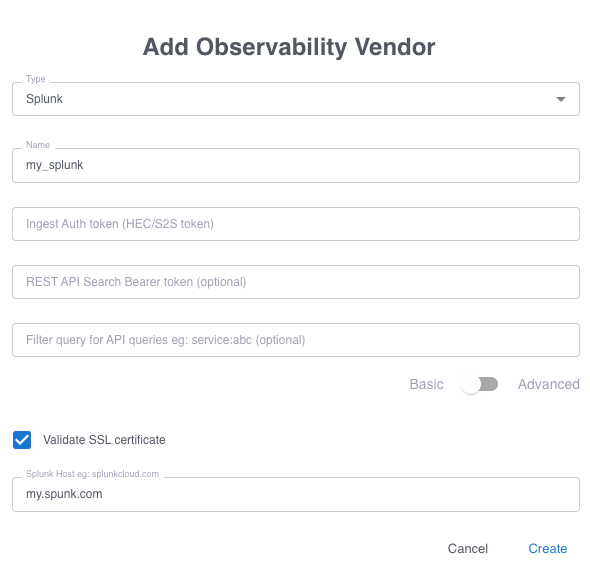
Select Splunk from the Type drop down. Give it a name and paste in the HEC token you saved earlier. Enter the name of the host where your instance of Splunk is running.
To work with Grepr your Splunk indexing server must have access tokens enabled. Grab a copy of the access token you want to use. On the Grepr dashboard select Integration from the top menu then click the “Add New” button under “Observability Vendors”. Click the toggle to “Advanced”.
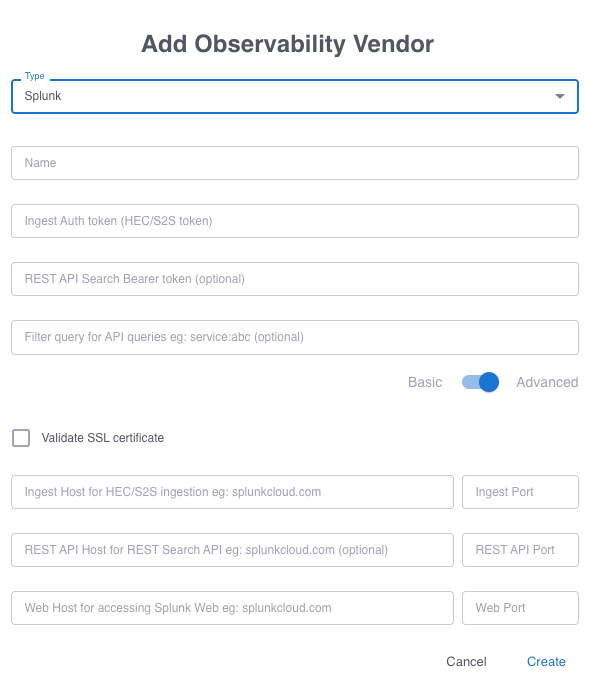
Give the integration a name and paste in the access token you copied earlier. Fill in the hostname where your Splunk instance is running and the appropriate port numbers, typically:
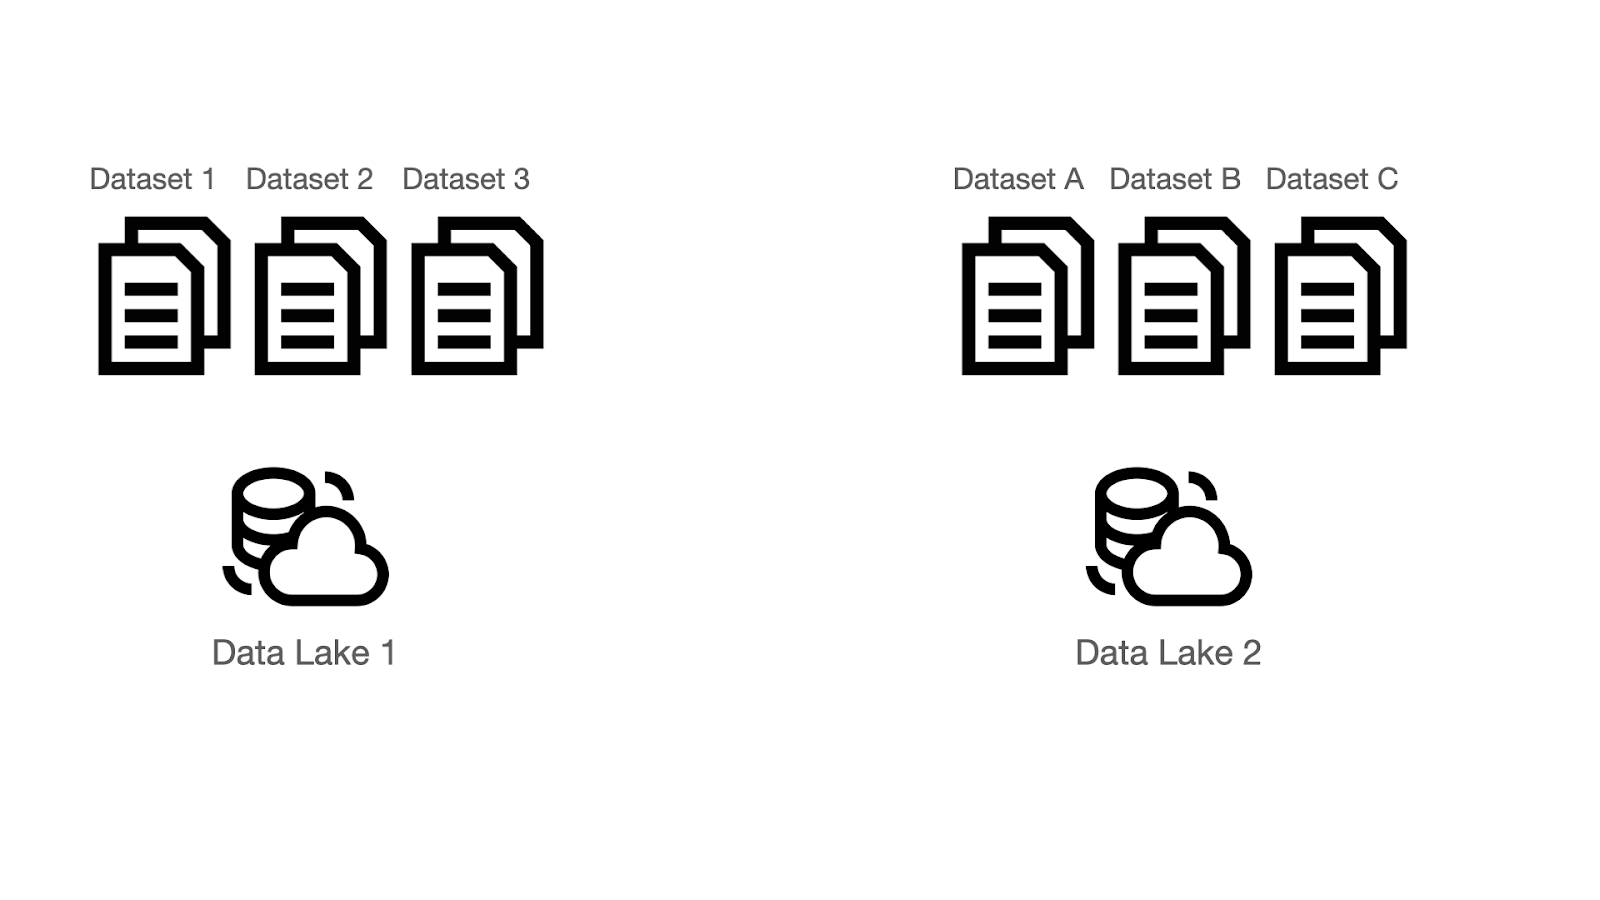
All data sent to Grepr is retained in low cost storage. Multiple data lakes can be used if you want to keep certain data separate from each other e.g. production and staging. Additionally multiple datasets can be defined inside each data lake e.g. security and application. Datasets can be used by multiple pipelines. Any dataset can be used as a destination from 1 or more pipelines.
On the Grepr dashboard select Integrations from the top menu then under “Storage” click the “Add New” button.
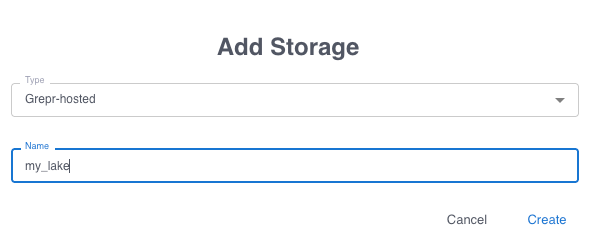
You use your own AWS S3 storage if you prefer, however for this example, we will use the Grepr hosted storage. Once this is created, a dataset is created using this storage. On the Grepr dashboard select Datasets from the top menu then click the “Add New” button.
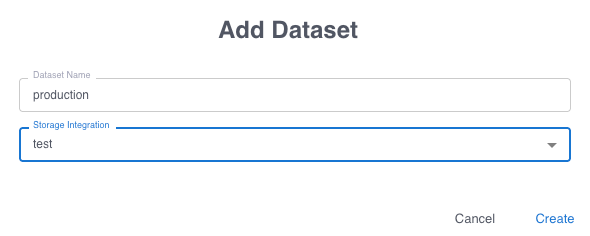
Give the dataset a name then select the storage you just created in the previous step.
Grepr does all its processing in a pipeline; multiple pipelines can be defined to support complex processing and routing of data across multiple sources and sinks. For this example, we’ll use just a single pipeline. On the Grepr dashboard select Home from the top menu then click the “Create Pipeline” button. Give the new pipeline a name.
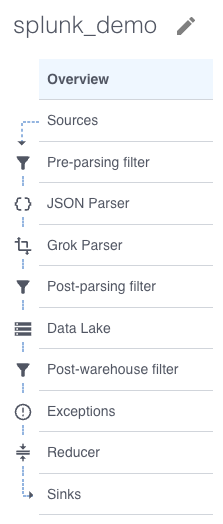
A new empty pipeline is created, the menu on the left shows the steps inside a pipeline. Don’t worry, most of those steps are optional. Starting at the top we will need a source, click on “Sources” then click the “Add” button.
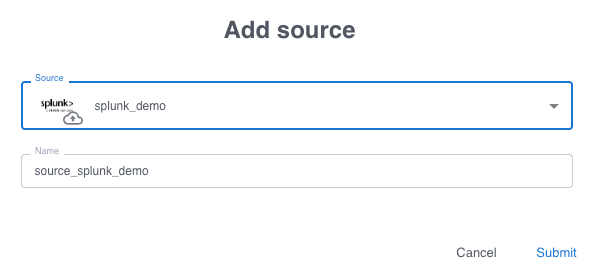
Select the observability vendor integration you created in the first step, the name is automatically filled in. When the form is submitted the source is added to the pipeline and a matching sink is automatically added. A pipeline can have multiple sources and sinks however, for this example we will keep it simple with just a single source and sink. The same sources and sinks can be used in multiple pipelines.
Before the pipeline can be created it must have some storage configured. Select “Data Lake” from the steps on the left then click the “Add” button.
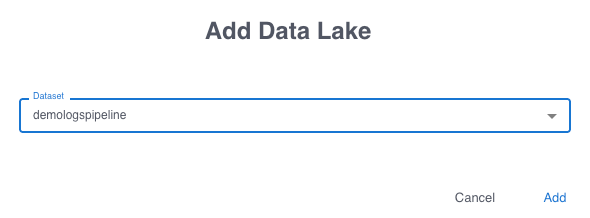
Select the dataset you previously created. A pipeline can store data to multiple datasets. You are now ready to create your first pipeline, click the “Create Pipeline” button at the top. It will take a few moments for the pipeline to be created and start running.
Once the pipeline has started, the log shipper can be configured. On the Grepr dashboard click on details for your pipeline.
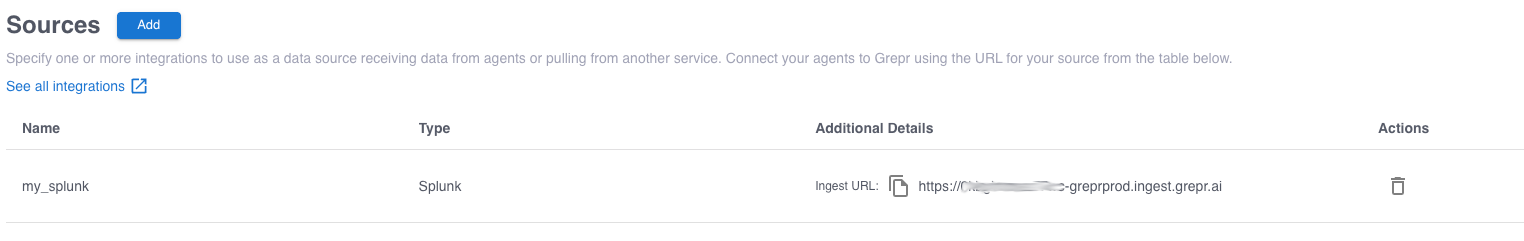
The ingest URL is shown on the right, click the copy icon to copy the URL to the clipboard, you will need this later.
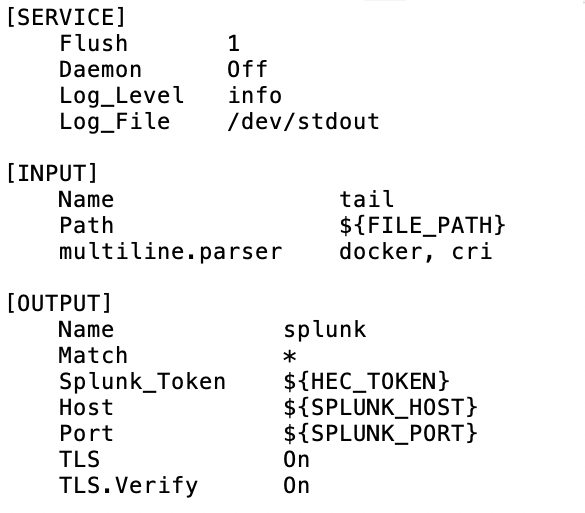
This example shows Fluent Bit running in a Docker container. The configuration is modified to ship logs to Grepr rather than Splunk.
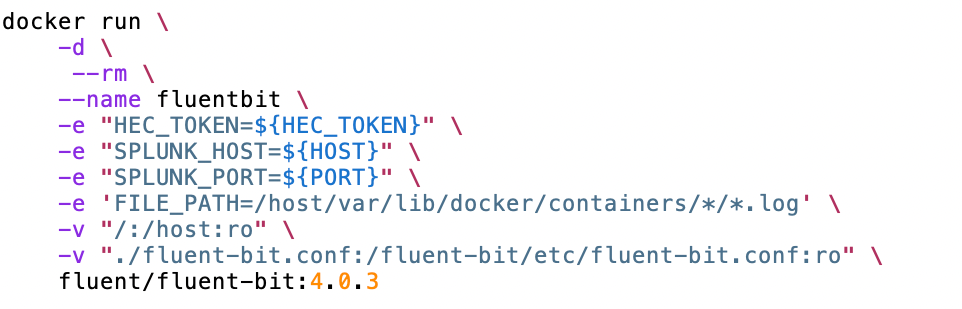
The configuration options are passed as environment variables and picked up in the configuration file.
NOTE - The default port for HEC is 8088 but when using Grepr it’s 443.
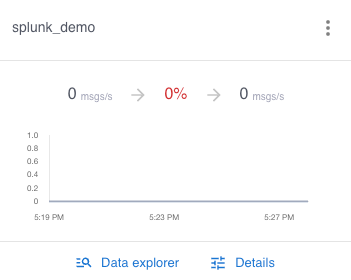
Once the configuration changes have been made and the shippers restart, the data will start to flow through Grepr on its way to Splunk.
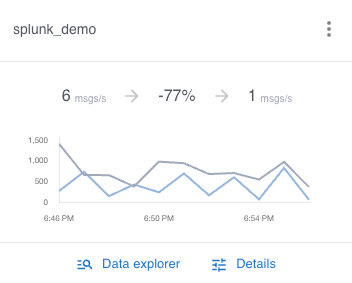
From a cold start Grepr is already reducing log volume by 77%, this will only improve the longer it runs and with a higher data throughput because the AI will continually tune the active set of filters. Looking at the logs now coming into Splunk you can see the summaries of the log messages. To see it in action see the demo on YouTube.
Once the pipeline is running, on the Grepr web dashboard go into the details of the pipeline and select sources from the left, the ingest URL is shown. Use this URL as a forwarder, for example with Splunk Universal Forwarder:
You can run the forwarder with multiple servers during switch over testing. The old forwarder can be removed after testing.
With just a few minutes work across a handful of steps you will soon have the power of Grepr’s semantic machine learning reducing the log volume by 90% while retaining 100% insight into your applications. Why not give it a try yourself? Sign up for a free trial today.