
Modern web pages are no longer just static HTML markup, they are complex applications themselves. Application frameworks such as React or Vue are commonly used to provide a richer user experience and enhance page performance by only updating partial page areas rather than rerendering the whole page. With profuse levels of code now being run inside the browser, using logging to understand code execution just like on the server side is normal practice. Browser logging can also be used to understand user behaviour as well by noting key interactions with the web application.
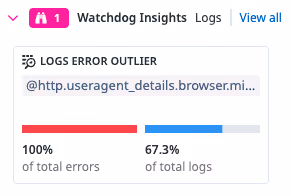
Using the Datadog browser logs SDK it’s possible to capture all those console messages from the code running inside the user’s browser. Once the logs are shipped to Datadog, analysis can be performed to identify possible problems with the code or to better understand how users are interacting with the website. The Datadog log viewer additionally provides automatic insights on the possible source of errors.
Manage Log Volume
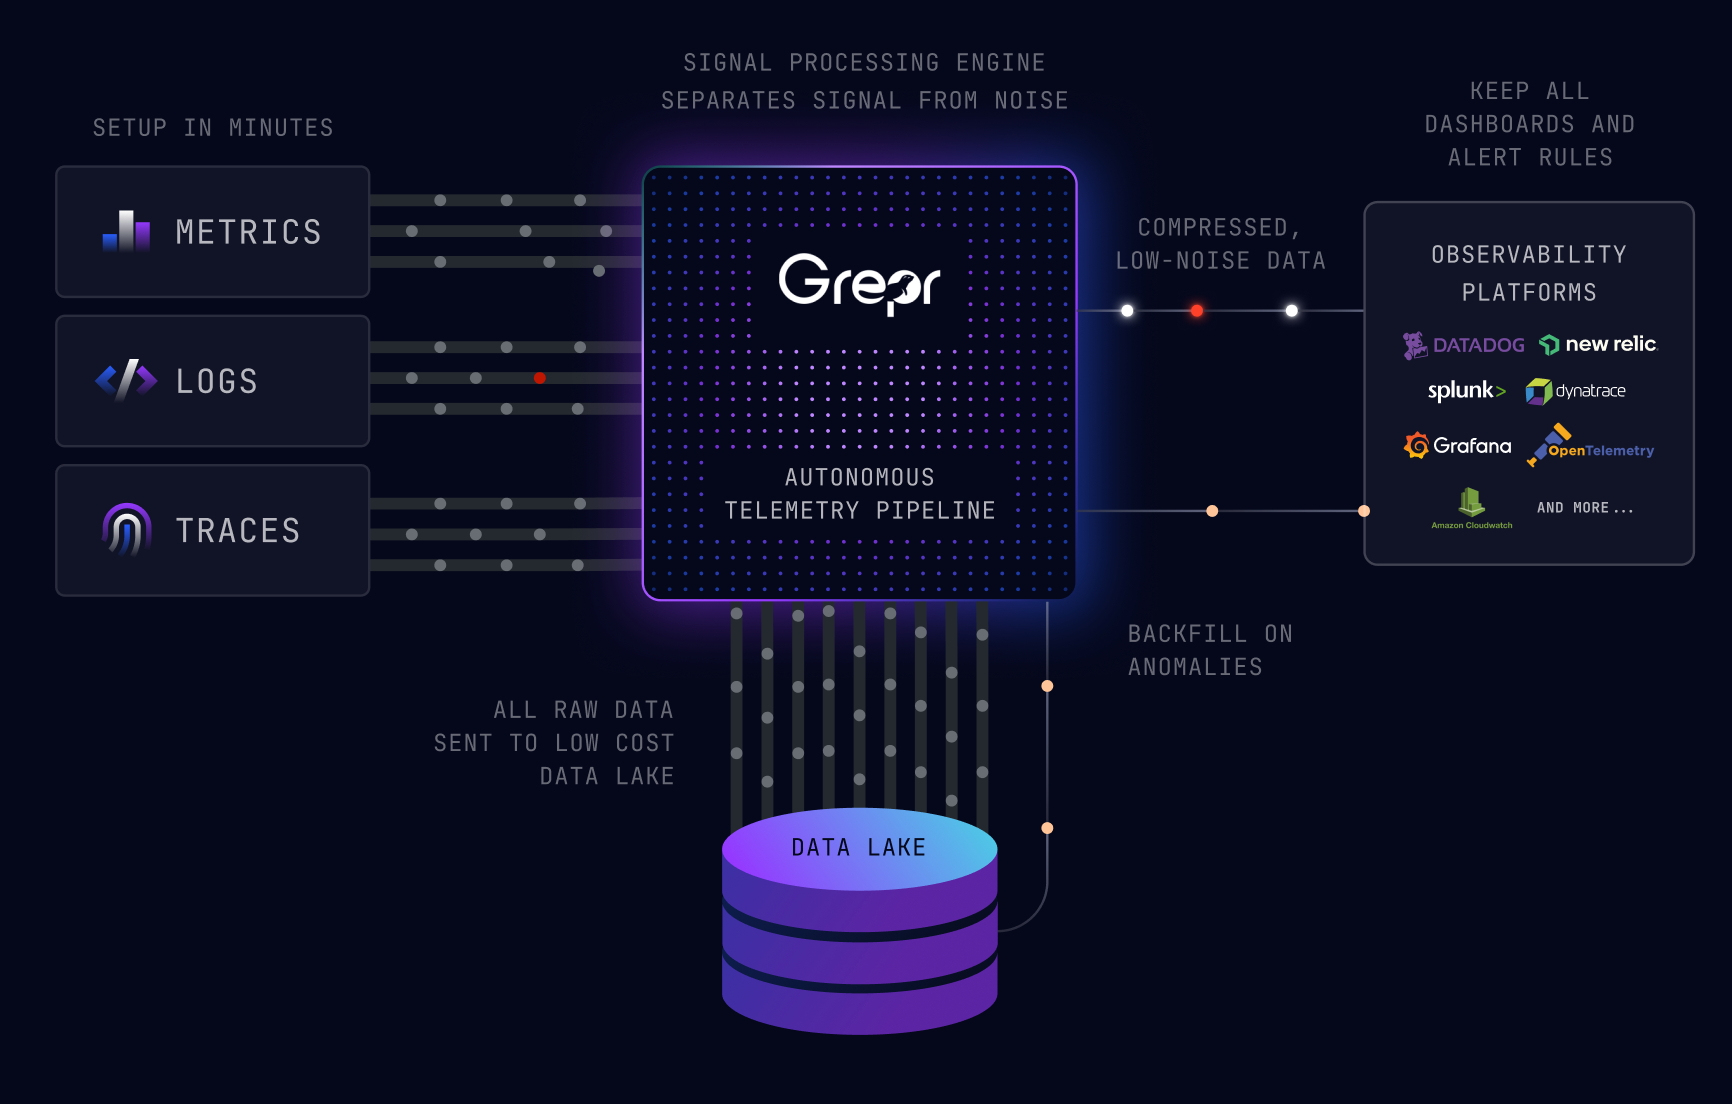
With a popular website the volume of browser logs can soon become large enough to start incurring substantial costs; Datadog charges by data volume. This is where Grepr can help by reducing the log volume sent through to Datadog without dropping any data; not all log data is useful all of the time.
With one small configuration change to the Datadog browser logs SDK, it will ship all logs to Grepr. All data sent to Grepr is retained in low cost storage then the Grepr dynamic AI powered filter reduces log volume by 90% by sending periodic summary information for the noisy messages while passing the unique messages straight through. Grepr operates on the semantics of the data to automatically consolidate, transform, analyse and route the observability data. Additional black list or white list filters can be manually created to handle the edge cases.
Because no data is ever dropped by the filters, it is always possible to see any log entry by querying via the Grepr web dashboard. No need to learn yet another domain specific language, the Grepr web dashboard supports the same query language used by the Datadog dashboard. The results of the search can be optionally submitted as a backfill job. This job will push the matching messages to Datadog so that all the data an engineer may need to investigate an issue is all in one place in the tool they are already familiar with.
100% Insight With 10% Data
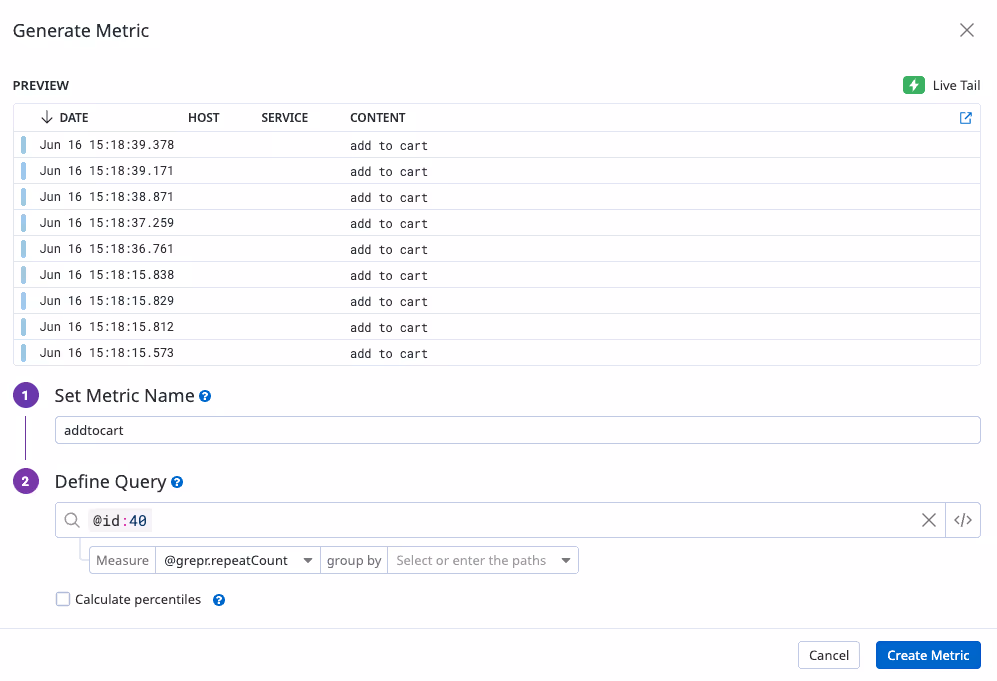
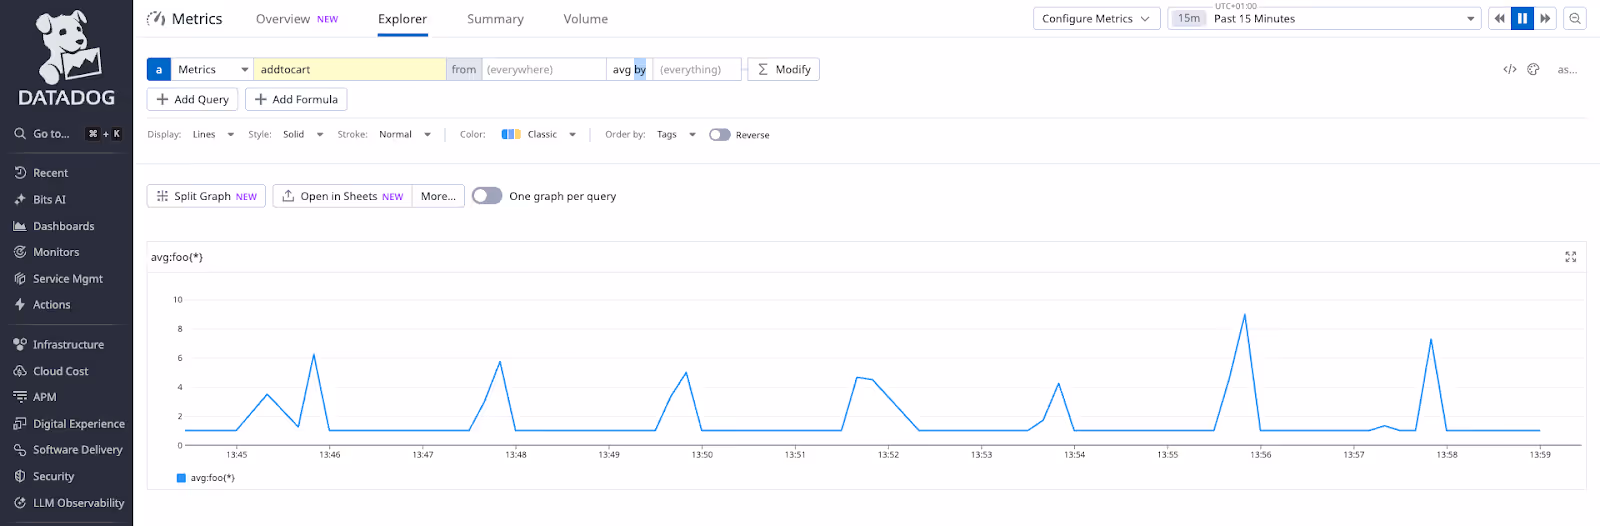
When using the Datadog browser log SDK to track user behaviour you may be concerned that the generated metrics would not be accurate when Grepr filters out 90% of the data. The summary entry sent through by Grepr includes a field for the number of messages covered by the summary thereby keeping your statistics accurate.
Repeats 12x in the past 58.14s: add to cart
In the metadata for this entry there is the field grepr.repeatCount which can be used to correct a Datadog generated metric.
Do More With Less
With Grepr you no longer need to worry about the cost of obtaining 100% insight into your web applications. You can collect all the logs you require to gain insight into application performance across different browsers and operating systems. There is no longer the need to set the sampling level at anything other than 100% on the Datadog browser logs SDK, Grepr will protect you from the cost explosion. With a full dataset you achieve deeper insight into user behaviour enabling you to optimise your website design.
More blog posts
All blog posts
How Envoy Reduced Observability Data Volume by 90% Without Touching a Single Dashboard
Grepr Just Launched a Free Tier: Reduce telemetry noise by 90%

Grepr Wins the 2026 Intellyx Digital Innovator Award for Observability Cost Reduction
Get started free and see Grepr in action in 30 minutes.
