

Tell me if you’ve heard this story. Someone asks why the Datadog bill keeps climbing, someone else answers they cannot cut retention because an incident burned them the last time they tried. The conversation ends there, the bill stays high, Datadog stock goes wild, and your data keeps piling up.
Observability data hoarding is not irrational. It is a rational response to an architecture problem most teams have not solved yet. The instinct to keep everything comes from real experience: not having a log when an incident hits. But that instinct points at the wrong fix. The problem is not that you failed to store enough. It is that finding the right data during an incident has always been slow, and teams responded by storing more, as if volume were the same thing as access.
Why observability log storage costs keep climbing
Observability platforms charge by ingestion volume, by storage, or both. When teams respond to incidents by increasing retention, they solve a symptom. The ingestion bill is not high because of a retention gap, but because you send everything upstream, regardless of whether it signals anything.
Modern distributed systems generate massive telemetry volumes. Billions of log lines per day is common at mid-scale. A large percentage of those lines are routine: healthy service handoffs, 200-status access logs, container heartbeats from infrastructure that has never touched an incident. You pay ingestion rates for data that has never informed a single investigation.
Your observability vendor has no incentive to surface this. I mean, why would they? They charge by volume. The more you send, the better their numbers look.
Heartbeat data versus heart attack data
Not all log volume carries the same value. Two categories cover almost everything.
Heartbeat data confirms that things work. Access logs from a stable service, routine health checks, 2xx responses from infrastructure running clean for months. This data has value at low resolution: you want to confirm the pattern is intact. You do not need every individual record.
Heart attack data is what you need during an incident. The rare event, the anomaly, the error pattern that surfaced two hours before the alert fired. This data requires full resolution and full retention. You need every line.
The cost problem comes from sending both categories to your observability platform at identical ingestion rates. Heartbeat data is not worthless… just worth far less than what you pay to store it there.
What log deduplication actually does
Grepr starts upstream of your observability platform. Before log data reaches Datadog, Splunk, New Relic, or Grafana Cloud, Grepr's ML pipeline analyzes the data that comes through. It identifies high-frequency patterns, the log lines that repeat at volume with essentially the same signal, and aggregates them. Unique events, anomalies, and anything your existing dashboards and alerts reference pass through at full fidelity.
That process produces a 90 to 95 percent reduction in the log volume your observability platform ingests. Your existing tools receive optimized data. Grepr automatically passes through data used for dashboards or alerts by parsing them and adding them as exceptions. You keep your dashboards, your query language, your on-call workflow. Your agents point to Grepr instead of pointing directly to your vendor. Everything downstream stays the same.
No data gets dropped along the way. Grepr stores every raw log line in a data lake built on Apache Iceberg and Parquet in your own S3 bucket. You own the storage and control the retention. The raw data is queryable using SPL, Datadog query syntax, or New Relic Lucene, whichever your team already uses.
How dynamic pipeline control handles incidents
The concern that comes up every time someone hears "aggregation" is the same: what happens when something breaks and you need the full data?
Grepr does not apply a static aggregation rule and stop there. It monitors your system state continuously. When it detects an anomaly, or when an alert fires in your existing monitoring tool via webhook, it does two things.
First, it increases granularity on the relevant data stream. The pipeline shifts from aggregation mode to pass-through for that service, that host, or that log pattern, and full-resolution data flows to your observability platform in real time.
Second, it triggers a backfill. Grepr pulls the raw data from the pre-incident window, the period before the alert fired, out of the data lake and injects it into your observability platform. You get the historical context you need without having paid premium ingestion rates to keep it there all along. That is retroactive coverage without the upfront cost.
This is the architectural shift that makes observability data hoarding unnecessary. You have not been storing everything because the data is valuable at ingestion rates. You have been storing everything because you had no way to retrieve it otherwise. Grepr solves the retrieval problem, which shrinks the storage problem.
Querying the data lake without a backfill
For investigations beyond what backfill covers, or for teams running historical analysis, the full raw dataset is queryable directly from the Grepr data lake. You are not limited to what passed through to your observability platform. Every ingested event sits there in open formats, queryable with the syntax your team already knows.
That capability changes how teams think about sampling. Sampling has a poor reputation because it creates gaps: if the incident fell outside the retained window, or if the sampled line was the one you needed, you are out of options. Grepr keeps the full dataset in low-cost object storage, accessible when you need it, at a fraction of the cost of keeping it in a premium observability index.
The real cost of observability data hoarding
The storage bill is the visible line item. It is not the full cost.
Query performance degrades with volume. An engineer working through 30 days of full-volume log data in Datadog moves slower than one working through a filtered, semantically organized dataset. Noise is not free to search. Every log line that is not the signal requires scanning and discarding, and at scale that latency compounds inside an incident.
Then there is the dashboard problem. Teams that ingest without discrimination tend to build monitoring surfaces the same way: more panels, more charts, more widgets. The dashboard stops being a tool for understanding a system and starts being a data museum. You walk through it hoping something catches your eye. That is not a monitoring strategy, only a symptom of having more data than you know how to make actionable.
How Grepr fits into your existing stack
Grepr is not a replacement for your observability platform. It sits between your log shippers and your existing tools. You point your agents at Grepr. Grepr forwards optimized data downstream. Your team keeps Datadog, Splunk, New Relic, or Grafana Cloud exactly as it is today.
No migration, retraining, or new query language. The bill goes down and the data coverage stays intact. Ta-da! For teams on Grafana Cloud, the reduction reaches 90 percent through a single configuration change, with no changes to your application or instrumentation.
The argument for keeping everything has always been that you cannot afford not to. With Grepr in the pipeline, the actual cost of keeping everything drops by an order of magnitude, and the retrieval problem that drove hoarding in the first place gets solved. Once you can query your full historical dataset from low-cost storage, the case for premium-indexed long-term retention mostly collapses on its own.
Frequently Asked Questions
What is observability data hoarding?
Observability data hoarding is when engineering teams store logs, traces, and metrics at full volume indefinitely, across every service, without aligning retention to what actually gets queried. It usually starts after an incident where missing data delayed resolution. The instinct is rational, but the fix targets the wrong problem. Unlimited retention does not improve incident response when the bottleneck is retrieval and signal-to-noise ratio, and that is where the real cost accumulates.
Does reducing log volume create blind spots during incidents?
Not when the reduction pairs with backfill capability. Static sampling creates blind spots because discarded data is gone. Grepr retains raw data in a low-cost data lake, and when an incident fires, the pipeline automatically increases granularity on the relevant stream and backfills the historical window into your observability platform. You get full incident context without having paid premium ingestion rates to store it there in advance.
How does ML-based log aggregation reduce observability costs?
Grepr's ML pipeline analyzes the semantic content of your log stream before it reaches your observability platform. High-frequency, low-information patterns, routine heartbeat data, healthy service responses at scale, get aggregated into representative summaries. Unique events, anomalies, and anything your dashboards or alerts reference pass through at full fidelity. The result is 90 to 95 percent less data reaching your observability vendor, with a proportional reduction in ingestion and storage costs. No data gets discarded. Grepr stores everything in your own S3 bucket in Apache Iceberg format.
Can I query historical logs without keeping full volume in my observability platform?
Yes. Grepr stores all raw log data in a data lake built on Apache Iceberg and Parquet in your own S3 bucket. You can query that dataset using SPL, Datadog query syntax, or New Relic Lucene directly from the Grepr dashboard. For historical data you want surfaced in your observability platform, you can trigger a backfill manually or configure it to run automatically when an alert fires. The full dataset stays available. You just stop paying to index it in an expensive platform until you actually need it there.
What observability platforms does Grepr integrate with?
Grepr integrates with Datadog, Splunk, New Relic, Sumo Logic, Grafana Cloud, and any OpenTelemetry-compatible platform. Integration means redirecting your existing log shippers to Grepr. Your downstream tools, dashboards, alerts, and query workflows stay unchanged. Grepr forwards optimized data to your existing platform with no migration and no retraining required.
How do I know which logs are safe to aggregate?
Grepr automatically catalogs the log patterns your existing dashboards and alerts reference and marks them as protected from aggregation. Data your monitoring depends on passes through at full fidelity by default. For everything else, Grepr applies aggregation rules based on signal density: how often a pattern appears, how much it varies, and how frequently it surfaces in actual incident investigations. You can also set manual pass-through rules for specific sources or patterns you want to preserve regardless of volume.
More blog posts
All blog posts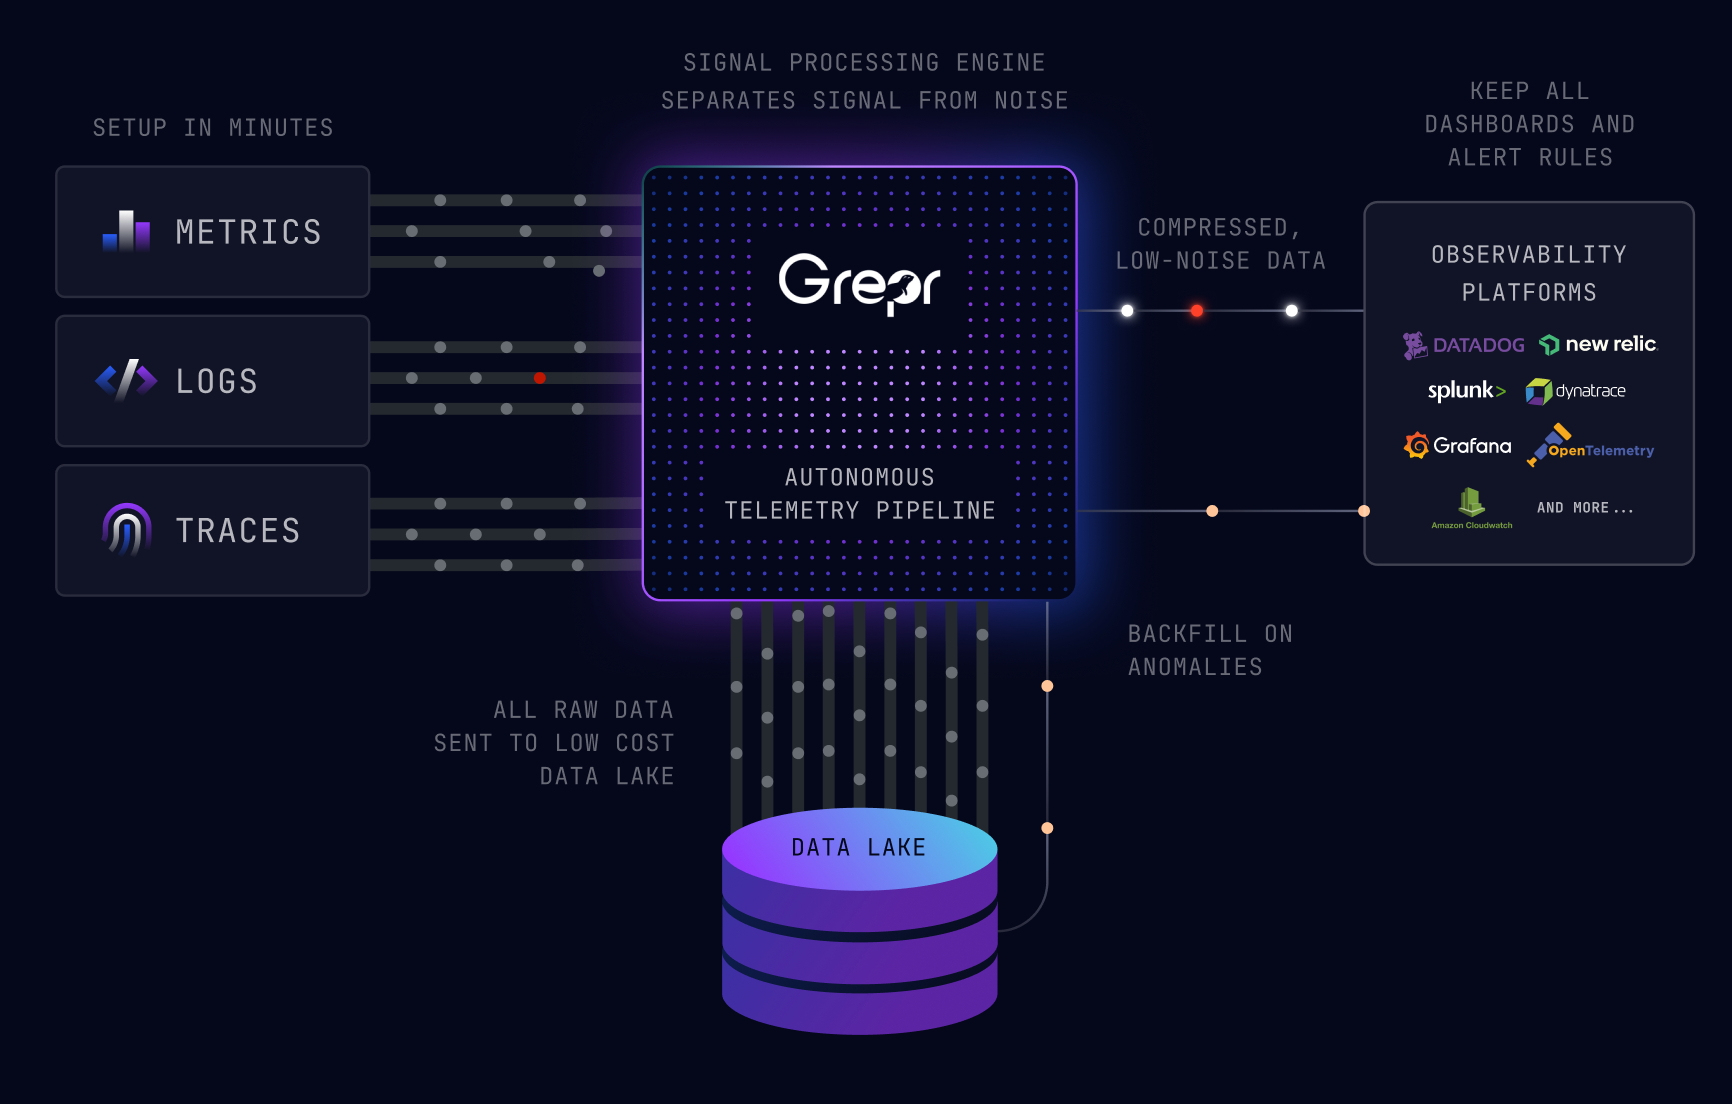
Grepr Just Launched a Free Tier: Reduce telemetry noise by 90%

Grepr Wins the 2026 Intellyx Digital Innovator Award for Observability Cost Reduction

What We Heard at Observability Summit 2026
Get started free and see Grepr in action in 30 minutes.
