

Observability is often seen as an expensive luxury by those who are not on the IT front line and there is constant pressure to contain IT costs. This can be seen with recent moves to replace some IT staff with Artificial Intelligence (AI). The challenge with managing spend on observability is that the cost is directly related to the volume of data and that modern application environments are becoming increasingly more complex therefore generating even more data. This results in IT managers being pulled in opposite directions, attempting to control costs and providing 100% visibility across an increasingly complex application landscape.
Superficially the solution appears simple enough, just reduce data volume; surely you don’t need all that data? This is partly true, most of the observability data that is collected is not needed all the time. There are fundamentally two tiers of observability data:
Heartbeat - This is the indispensable data that is required all time to know that the applications are processing requests in a prompt and error free manner; this data proves that applications are alive and healthy. This is also the data that SLO are measured against and is the source of alerts to inform engineers that something broke. Data reduction is not an option here.
Diagnostic - This is the data that is only used occasionally when there is an issue or incident that requires to be investigated and resolved. Unfortunately this makes up the bulk of the observability data. Without it engineers would have an impossible task restoring services in the event of an outage. Murphy’s Law now comes into the mix, clearly stating that the data you choose to drop is exactly the data you will need to investigate the next issue or incident.
This presents quite the conundrum for IT managers, how to retain 100% visibility with less than 100% of the data. Impossible?
Impossible Becomes Possible
The Grepr Intelligent Observability Data Engine can provide 100% visibility with just 10% of the data along with the associated observability platform cost savings.
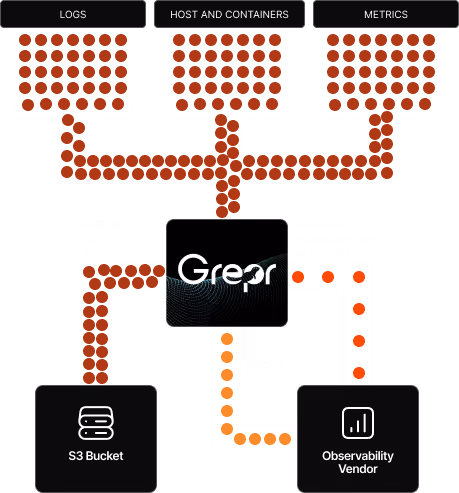
Grepr slips in like a shim between the observability agents sending the data and the observability platform collecting, processing and storing the data. The minimal installation just requires configuring Grepr to ship data to the observability platform and configuring the agents to send data to Grepr rather than the normal backend. That’s it job done. From here Grepr’s intelligent data engine takes over, it performs semantic analysis of the data passing through then utilising machine learning, it determines what information can be summarised and what information should go straight through.
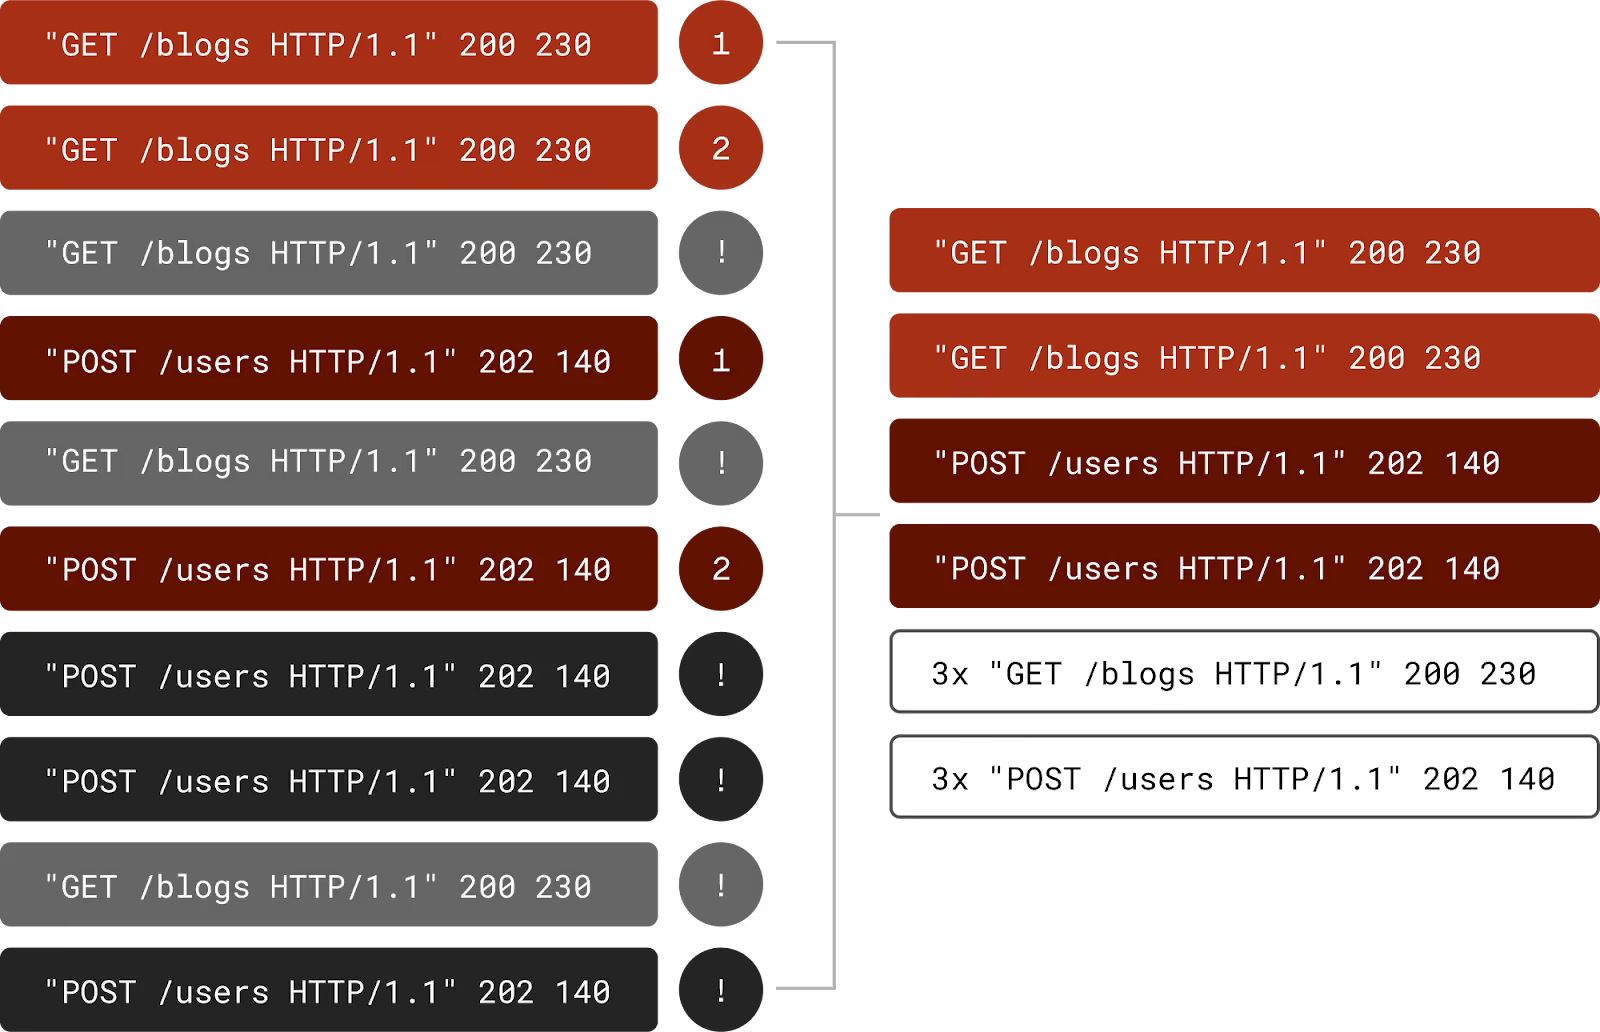
Most importantly no data is dropped, all data sent to Grepr is retained in low cost storage where it can be analysed and optionally selectively backfilled to the observability platform. The outcome is that the vital heartbeat information is still available and the bulky diagnostic information is retained in Grepr. This reduces the volume of data ingested by the observability platform by 90%. When an issue or incident occurs, the relevant diagnostic data for the time period in question can be automatically and/or manually backfilled from Grepr to the observability platform ensuring engineers have 100% visibility around that issue or incident to quickly restore service levels.
100% Visibility With 10% Data
With Grepr the impossible is possible, observability platform costs can be slashed by 90% while maintaining 100% visibility ensuring engineers have all the data they need at their finger tips. Appease the board with cost savings and keep the engineers happy all at the same time with Grepr Intelligent Observability Data Engine.
More blog posts
All blog posts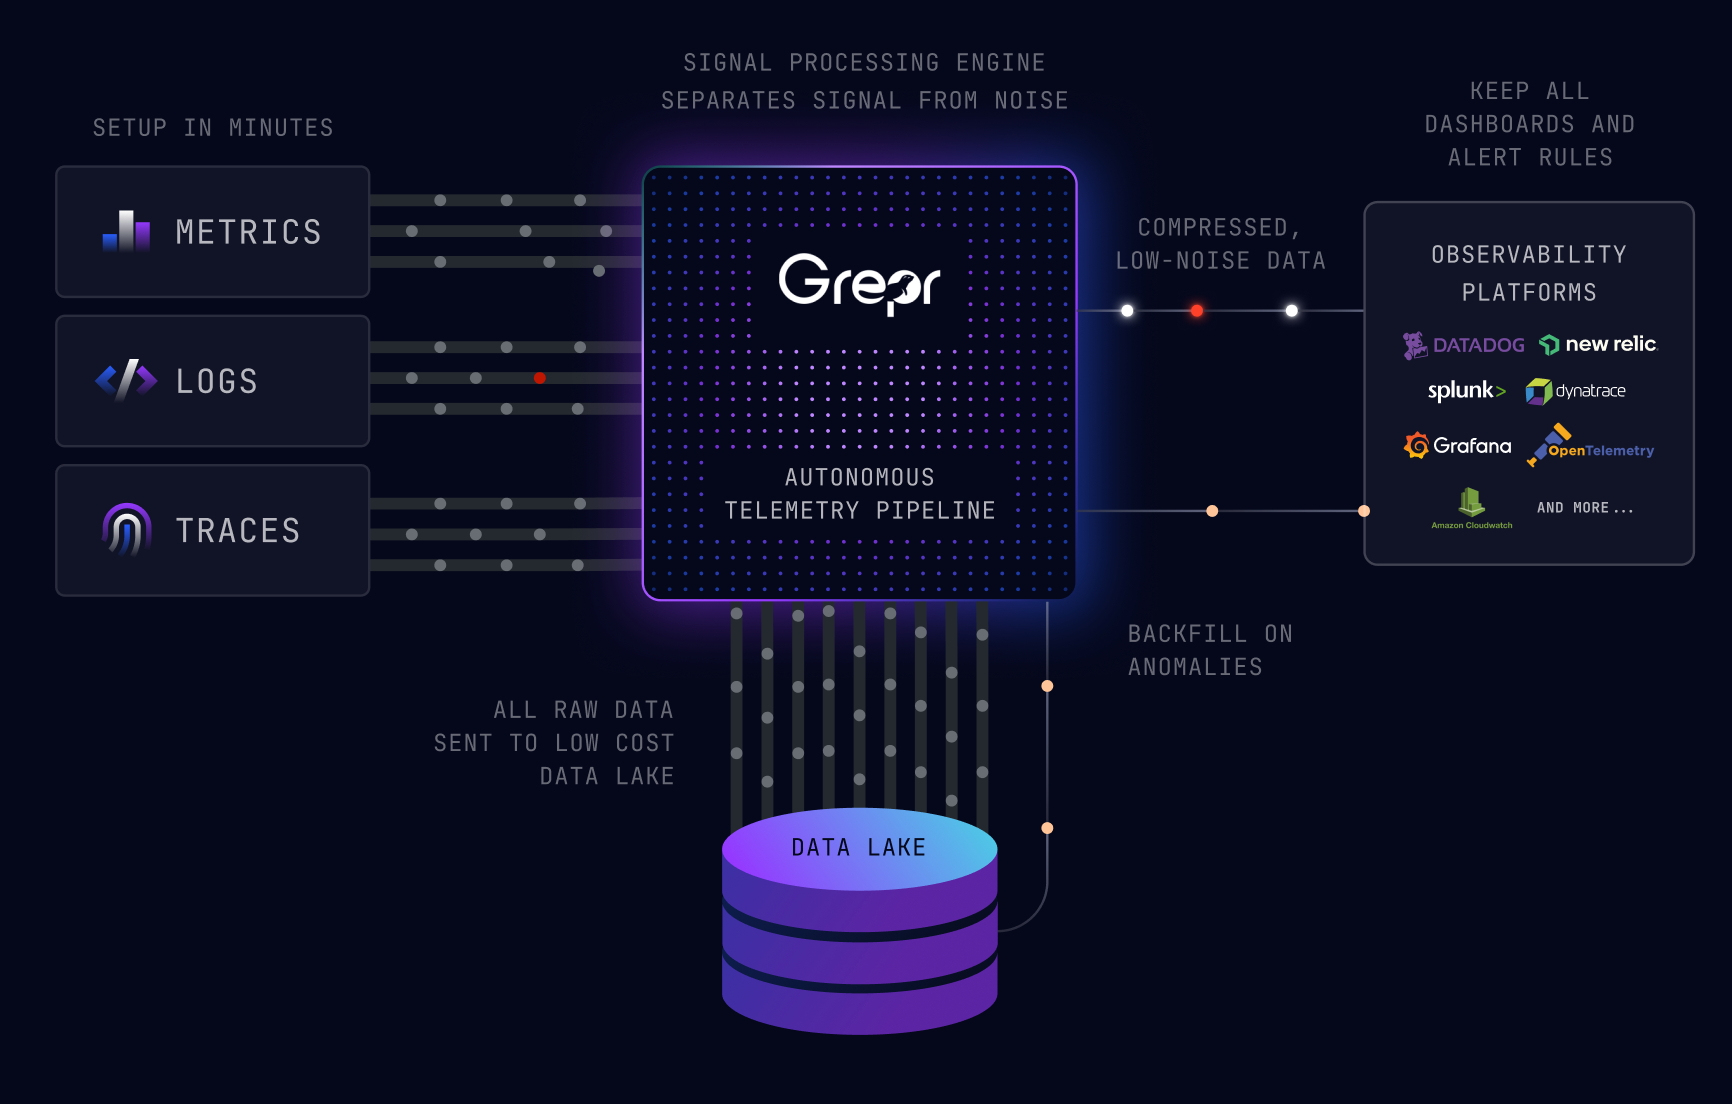
Grepr Just Launched a Free Tier: Reduce telemetry noise by 90%

Grepr Wins the 2026 Intellyx Digital Innovator Award for Observability Cost Reduction

What We Heard at Observability Summit 2026
Get started free and see Grepr in action in 30 minutes.
