

First a quick recap on what backfill is and why it’s useful when attempting to resolve issues. Grepr Intelligent Observability Data Engine sits between the log shippers and the aggregation and storage backend. Using machine learning it automatically detects similar patterns across verbose log messages. These are then forwarded as message summaries to the backend. Unique low frequency messages are passed straight through. All data sent to Grepr is retained in low cost storage and is accessible at any time via well known query syntaxes: Splunk, Datadog, New Relic. The results of a query may be optionally submitted as a backfill job, populating the backend with all the messages that were originally only sent through as summaries. This provides an unabridged dataset covering the time period of the issue under investigation.
Manual backfill is of course very useful but it would be more convenient and a bit quicker to have it happen automatically when there is an issue. There are a couple ways to achieve this.
Webhook
Monitoring systems may be configured to call a webhook passing event details when an alert is triggered. A webhook can be written to inspect the event details, build a query and submit it to Grepr via its REST API as a backfill job. See Dynamic Callback Exceptions in the documentation.
Datadog
A webhook can be called via a special notation in the message text of the alert.
New Relic
A webhook can be added to an alert workflow.
Splunk
A webhook can be configured as an alert action.
Rule Engine
Grepr has rules based exceptions that trigger when a condition is met, stopping aggregation and performing backfill for a period of time before the event. To configure this go to the Grepr dashboard then drill in to the details for your pipeline. Under Exceptions, click the Add button.
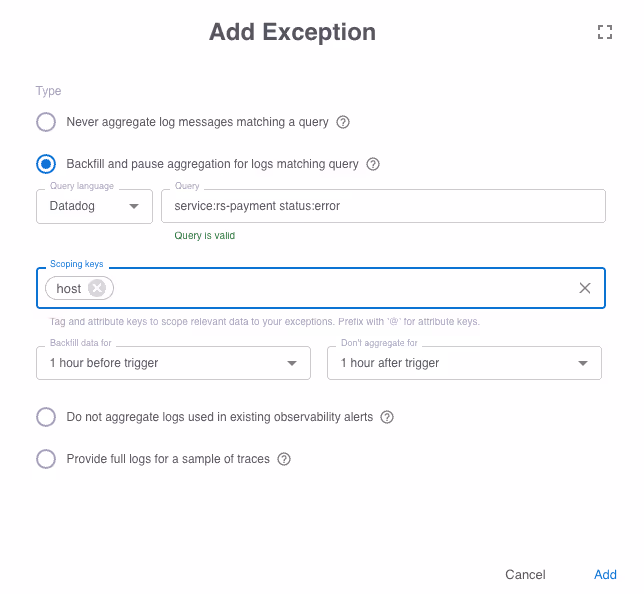
Enter a query to select the trigger condition. In this example when the service “rs-payment” logs a message with an “error” status, it will trigger a backfill for data up to one hour before. The scoping tag of “host” means that only messages from the same host as the trigger will be backfilled. Alternative tags that could be used include: pod-id, container-id, namespace, etc. This ensures that the required insight is available without dumping too much data to the aggregation backend, thus minimising usage costs.
The status of the exception is shown once it has been created.
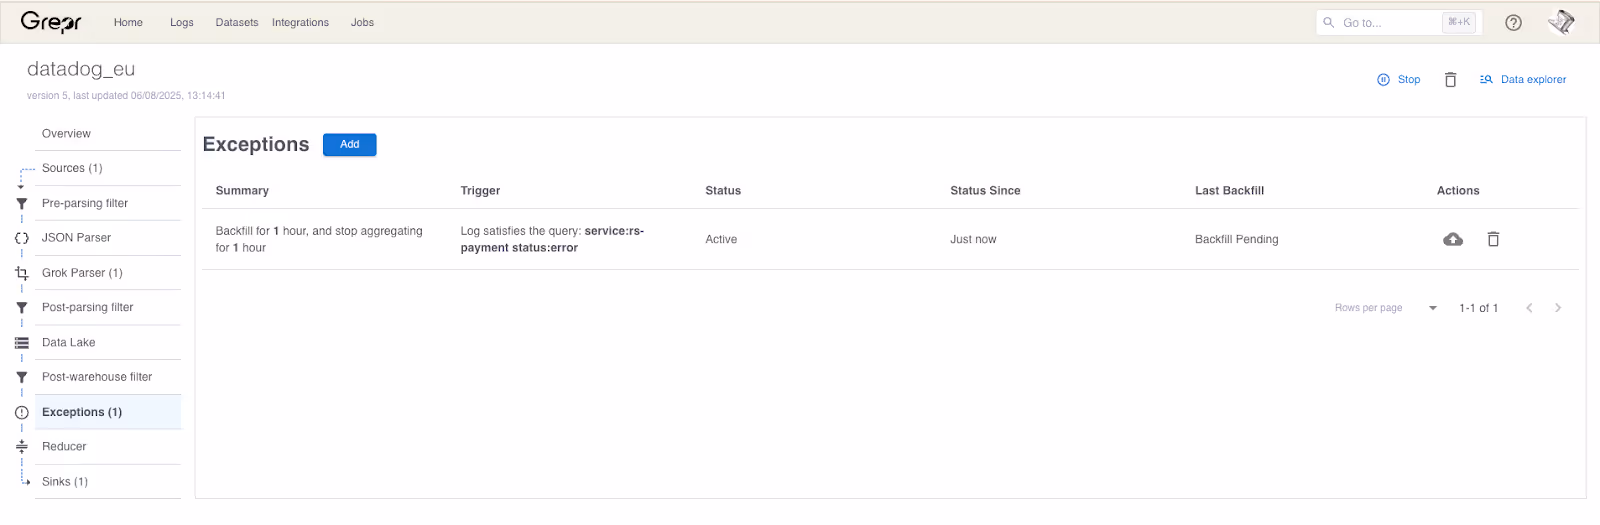
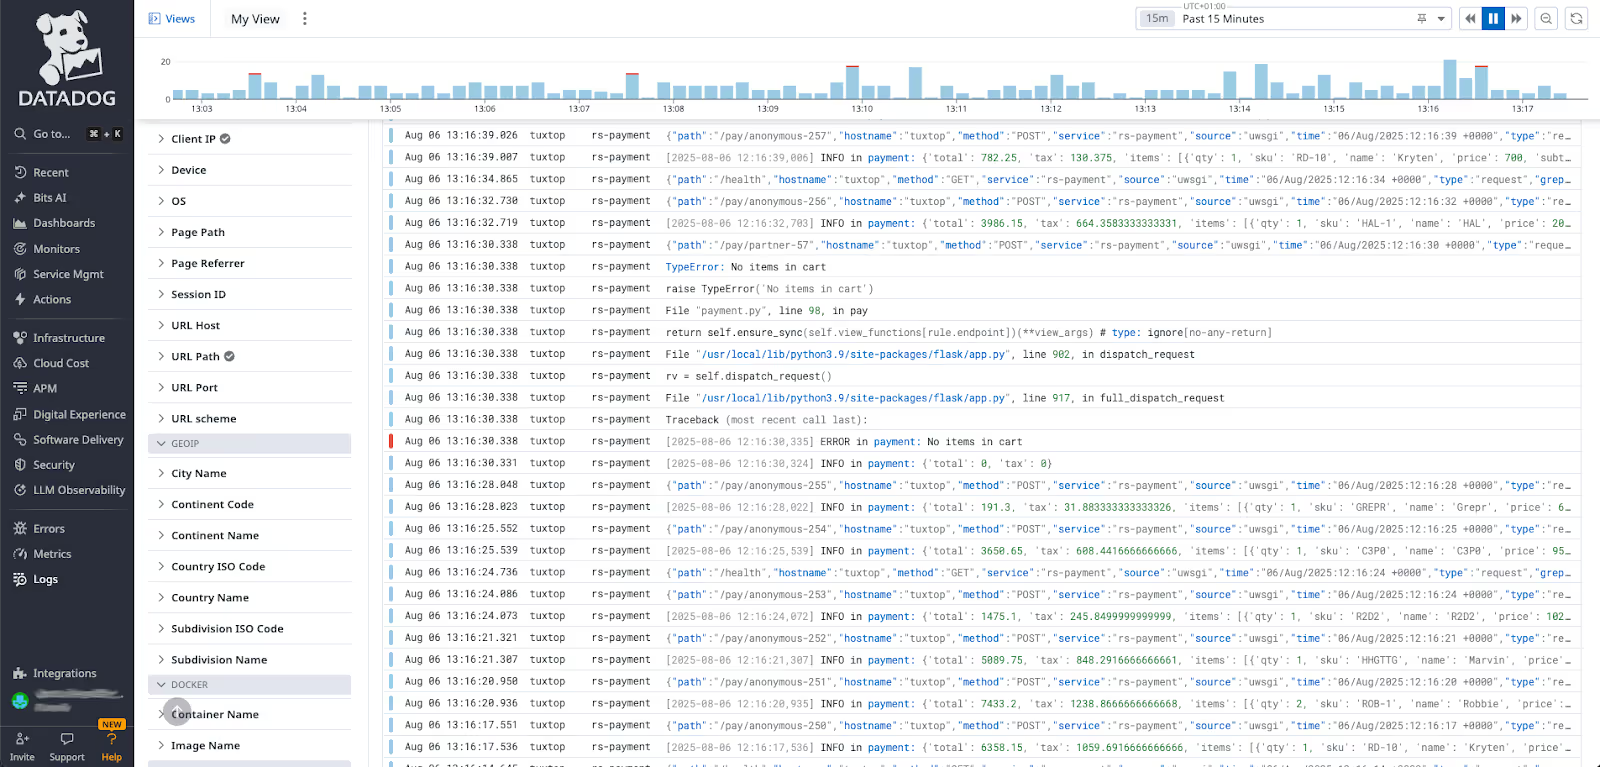
This shows that the rule has just been triggered and the backfill job has started. Once it completes in a few moments all the data will be available to view in the aggregation tool.
Automatic Convenience
Performing manual ad-hoc backfill queries provides ultimate flexibility when investigating issues. However, fully automating backfill on issue detection saves time and eases workflow. Grepr gives you the option of utilising both approaches for optimal operational efficiency. When using automatically triggered backfill, remember to consider carefully how often they might be triggered. Over triggering backfill jobs will send more data to the aggregation backend thus reducing the potential usage cost savings that Grepr provides.
More blog posts
All blog posts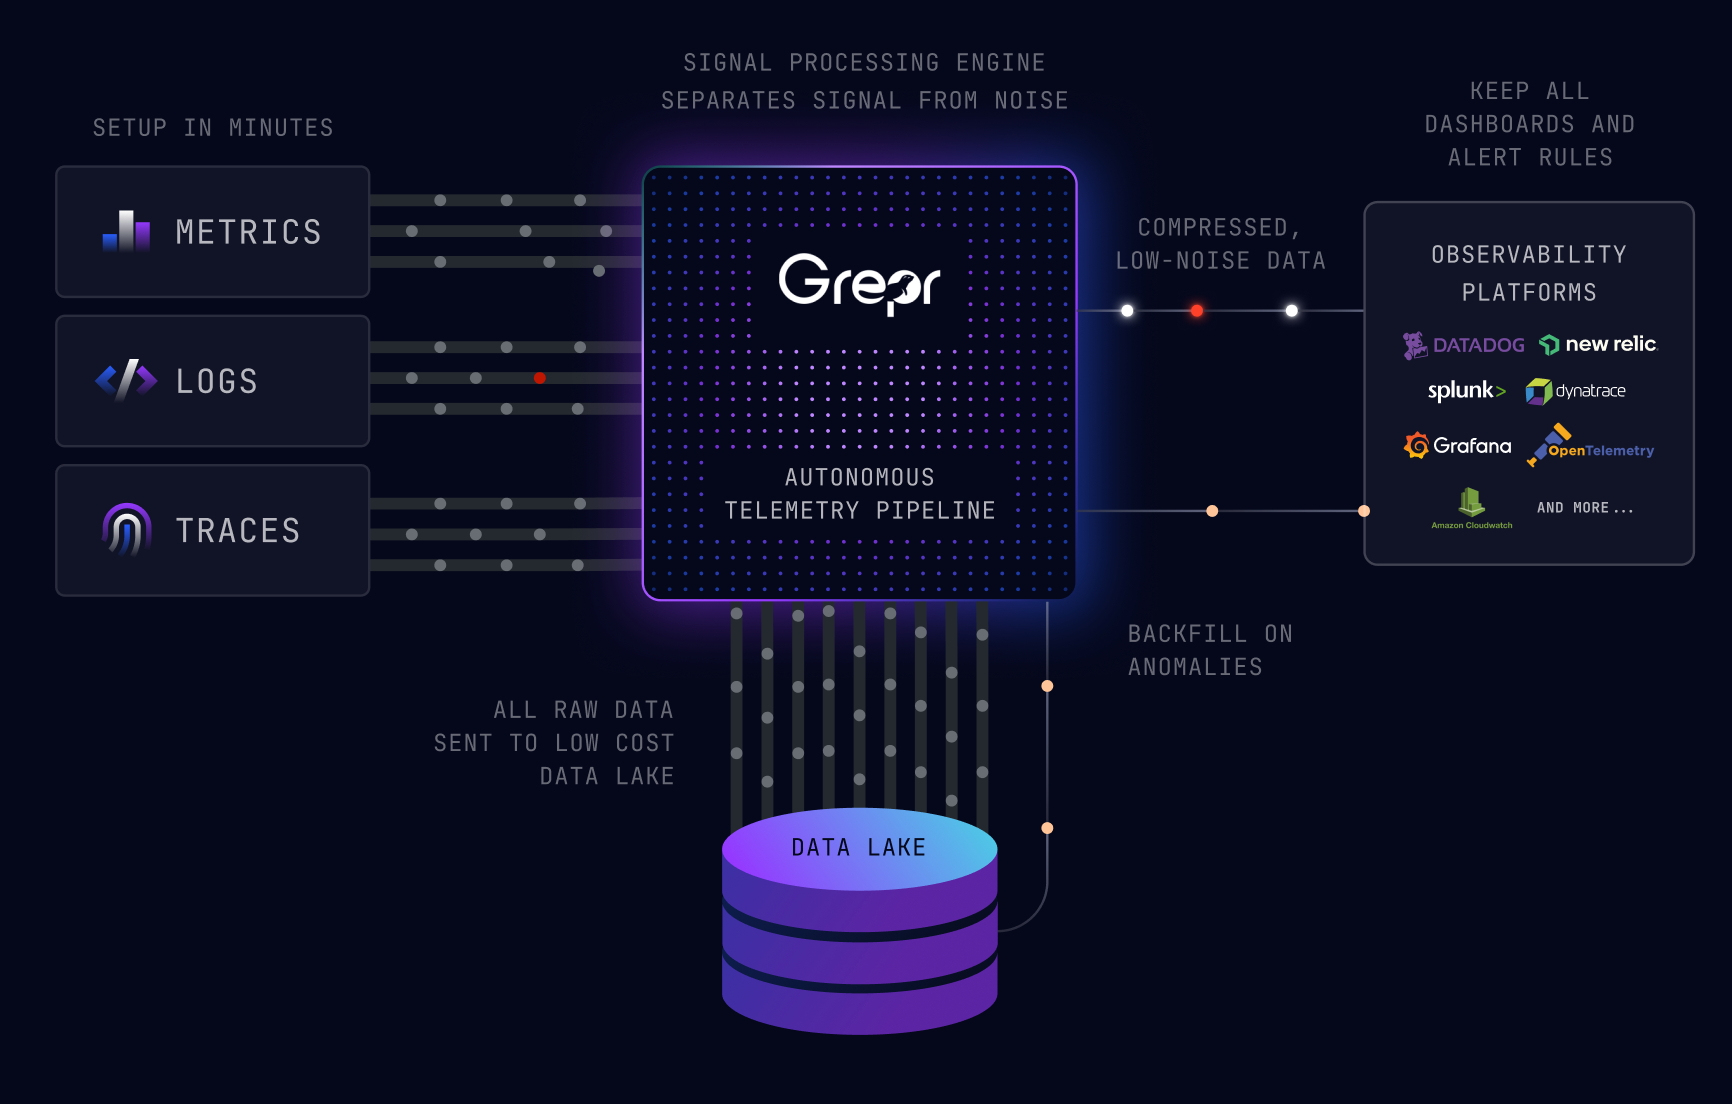
Grepr Just Launched a Free Tier: Reduce telemetry noise by 90%

Grepr Wins the 2026 Intellyx Digital Innovator Award for Observability Cost Reduction

What We Heard at Observability Summit 2026
Get started free and see Grepr in action in 30 minutes.
