

You have a Grepr pipeline that has been in production for a while and now you need to add a Grok parser and some exceptions. However, because the pipeline is in production processing real data you have to be careful not to make any mistakes and potentially corrupt the data stream. With live edit you can now make those changes and immediately see the results with zero risk of impacting live data.
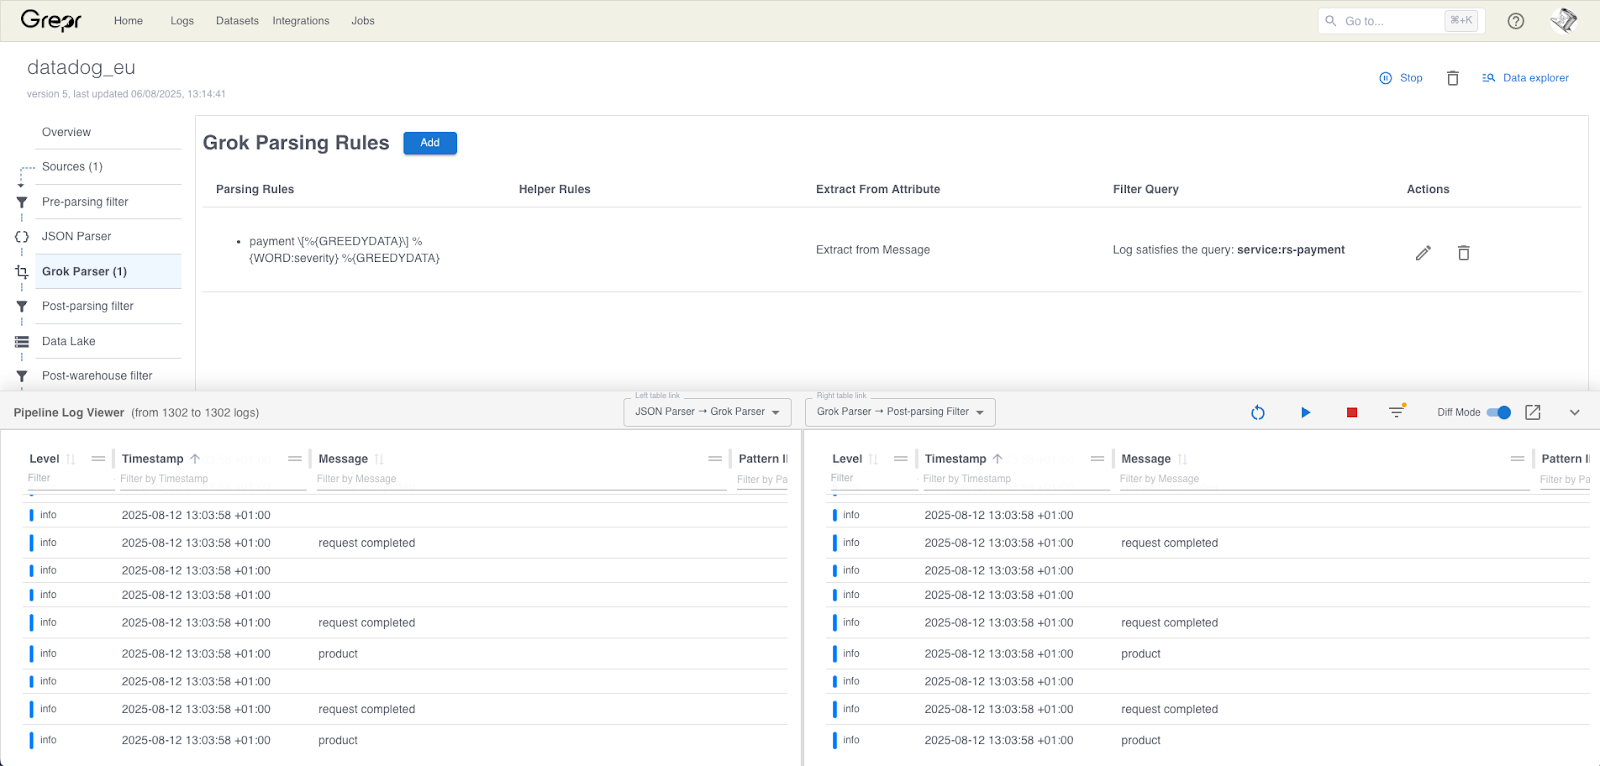
Looking at the details of your pipeline in the Grepr dashboard, there is a new dialog docked at the bottom. This is the live view, when you enable it, a temporary clone of the current pipeline is created in the background. Live view can be used to see that data at all steps in the pipeline and perform a diff on selected messages. This enables you to immediately see the effects of any changes you make to any of the processing steps. The example screenshot above shows data entering and exiting the Grok parser.
Any changes that are made but not applied only happen in the cloned pipeline and are visible in the live view. The cloned pipeline will not write any data to the configured data lakes and not send any data to the configured sinks. Only when any changes are applied to the original pipeline will live data be changed.
Walk Through
A legacy Java application does not log in JSON resulting in the severity of the messages not being correctly tagged. The raw log:
2025-08-12 14:39:53.734 ERROR 1 --- [nio-8080-exec-9]
c.i.r.s.Controller                       : SlowQuery: 1089
milliseconds. SQL: 'select city0_.uuid as uuid1_0_, city0_.city as
city2_0_, city0_.country_code as country_3_0_, city0_.latitude as
latitude4_0_, city0_.longitude as longitud5_0_, city0_.name as
name6_0_, city0_.region as region7_0_ from cities city0_ where
city0_.country_code='us''
How it appears in Datadog:
{
"hostname": "tuxtop",
"service": "rs-shipping",
"grepr": {
"receivedTimestamp": 1755009595862,
"patternId": "0MM0MB85DQ8WM",
"repeatCount": 1
},
"status": "info",
"timestamp": 1755009593735
}The status of “info” is the default severity assigned by Grepr. An extra Grok parser can be used to pick up the severity from the message. Of course we want to test this out before deploying to our production pipeline, this is where live edit comes to the rescue.
In the detail view for your pipeline, select Grok Parser from the pipeline flow on the left then click the add button.
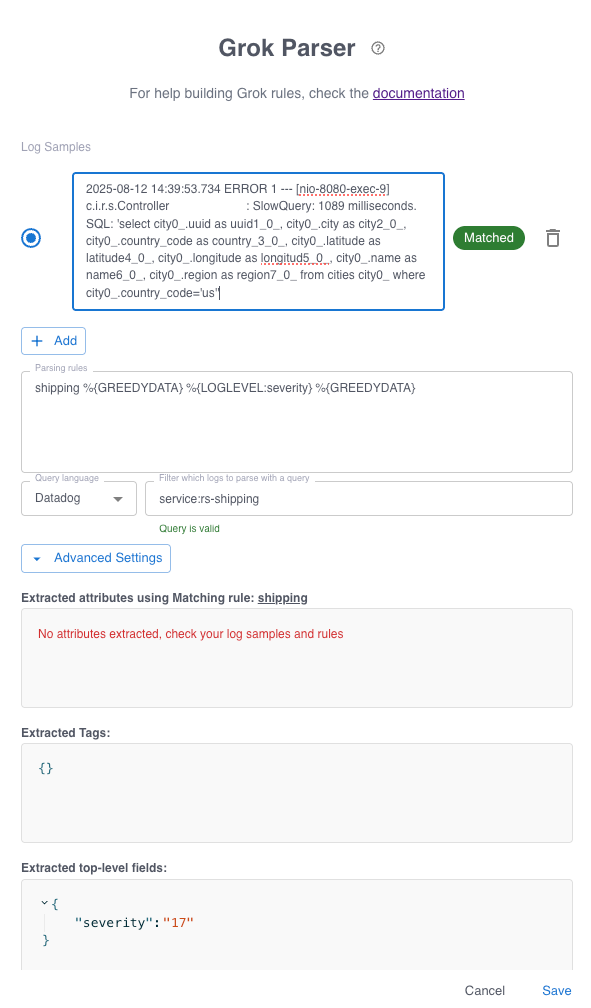
The diglogue is interactive and shows in real time how the Grok expression is evaluated and the fields which are extracted. The example above shows the ERROR being extracted as a severity of 17. See the Grepr documentation for details on how severities are mapped. Save the dialogue but DO NOT apply the changes.
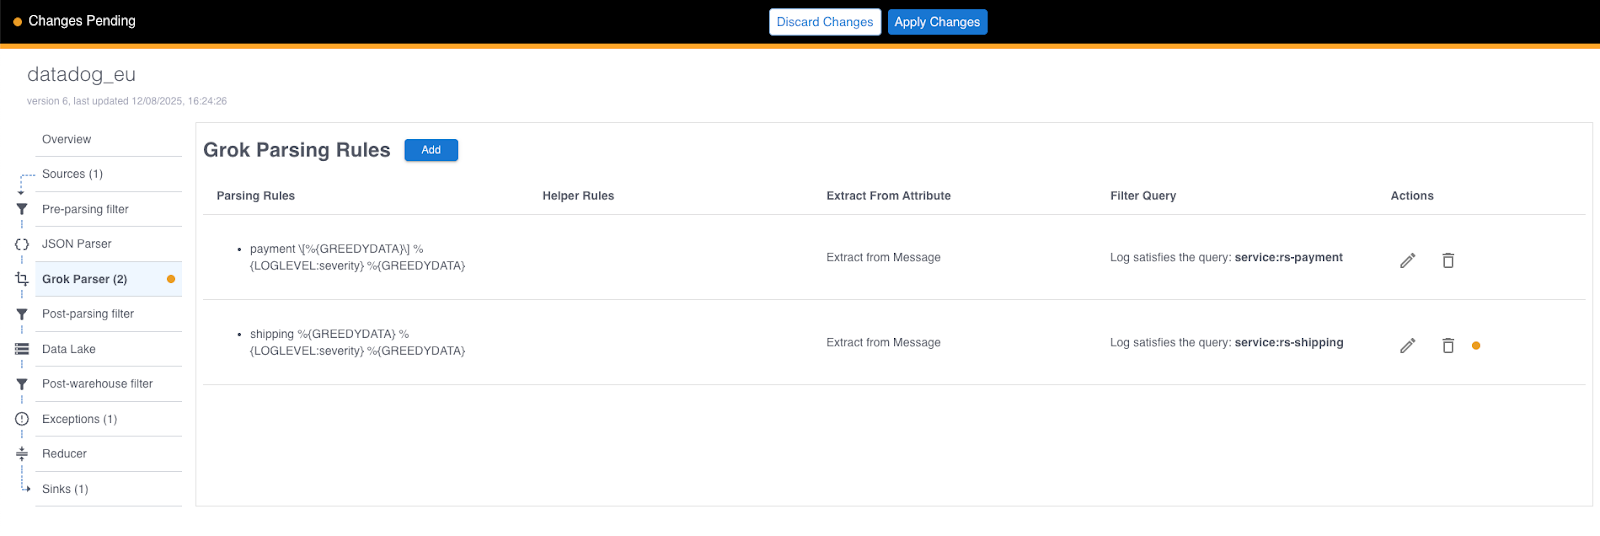
Now you can use the live view to see how your staged change is working. The live view is a pull up at the bottom of the dashboard.
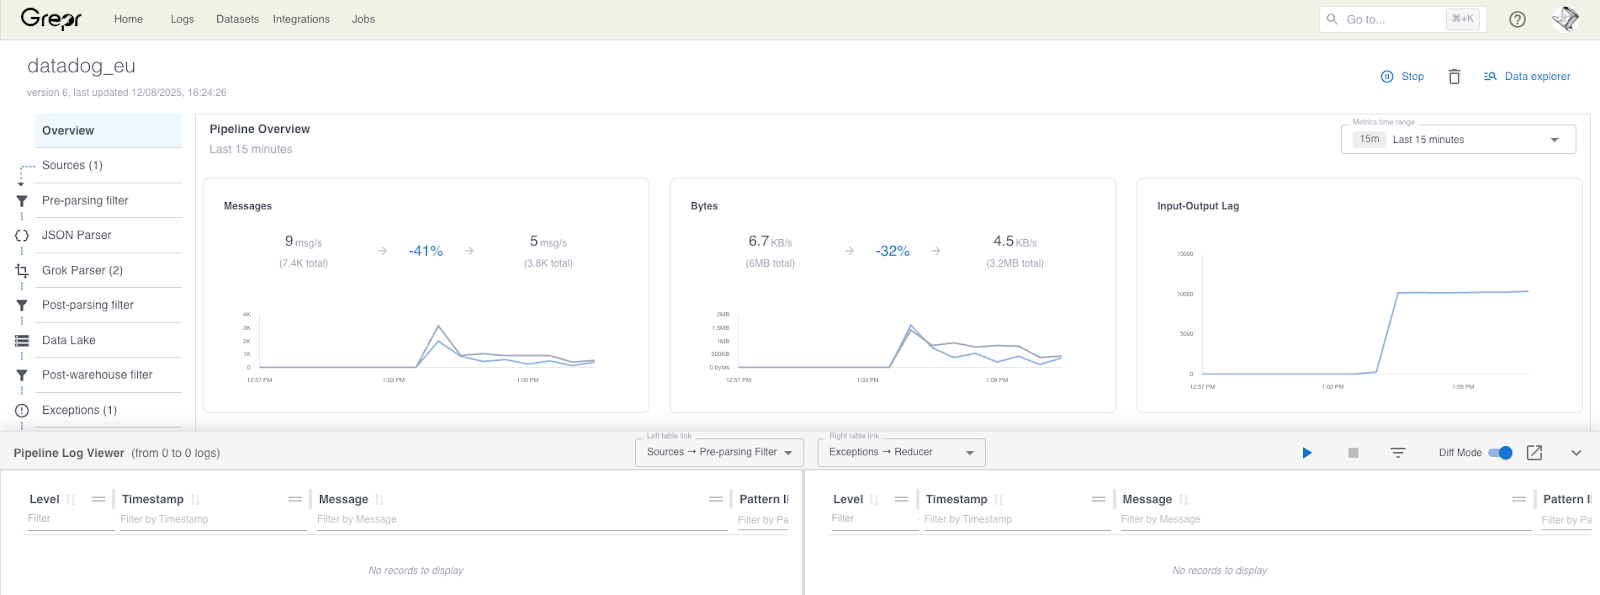
Clicking the play button clones the pipeline which takes a few seconds; please wait. Now you can see how the data is transformed as it passes through the various steps of the pipeline. You can filter and search for records you are interested in. Clicking on a record brings up a detail panel showing the record data as it is in the left and right panes along with a diff of the two.
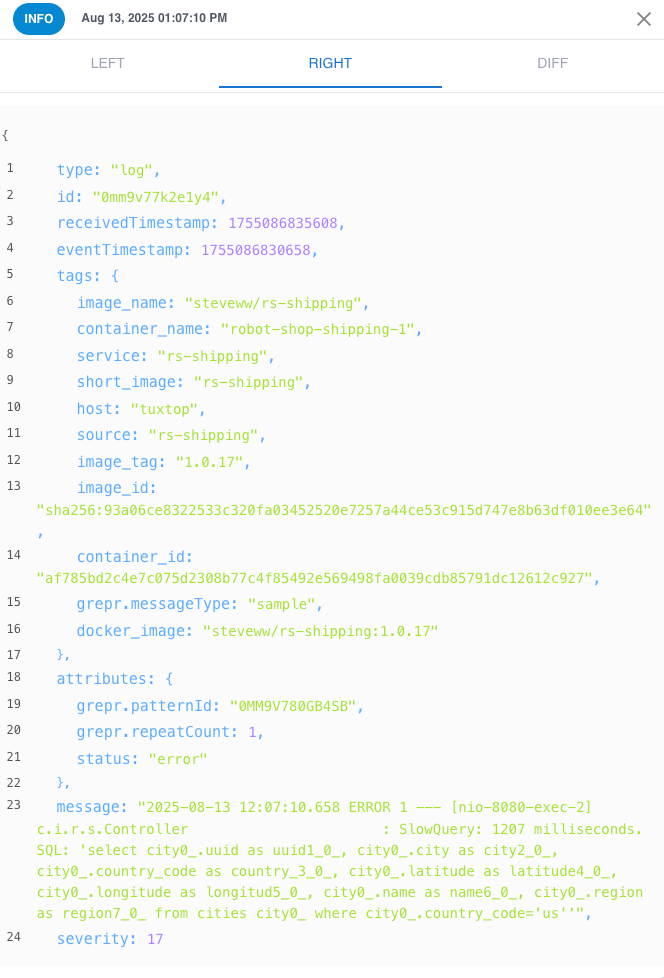
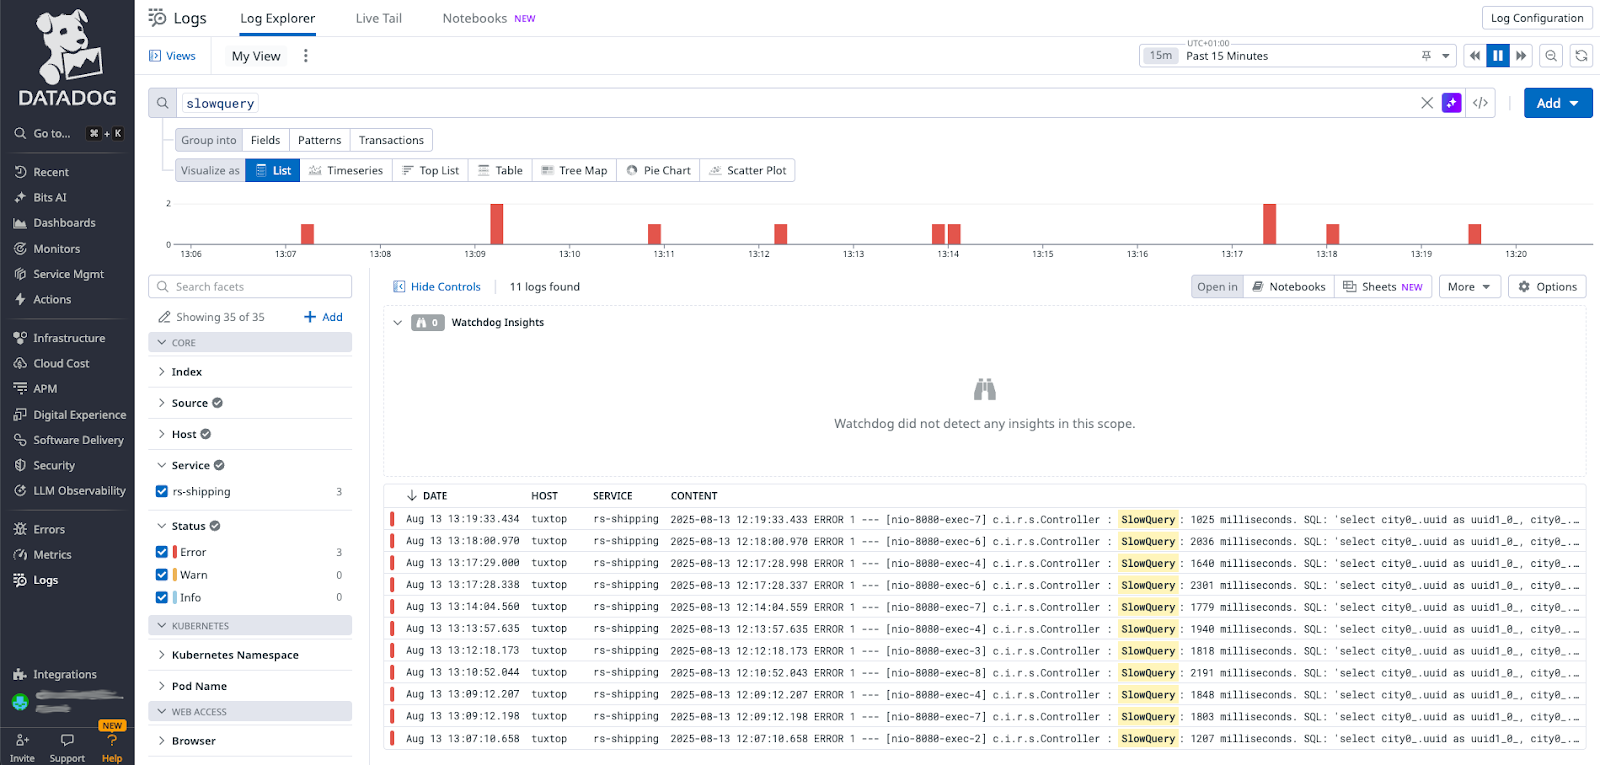
To complete the example the slow query error log Grok expression is working, the severity and status fields are now set correctly and are now showing up in Datadog correctly as errors.
Look Before You Leap
With the new Live Edit feature you can now validate changes to the pipeline processing steps without the fear of corrupting live data. Changes are initially made in a clone of the production pipeline which does not persist any data to the data lake nor send any data to the configured sinks. Only once you have validated that the staged changes are working as expected, do you commit those changes to the live production pipeline.
More blog posts
All blog posts
How Envoy Reduced Observability Data Volume by 90% Without Touching a Single Dashboard
Grepr Just Launched a Free Tier: Reduce telemetry noise by 90%

Grepr Wins the 2026 Intellyx Digital Innovator Award for Observability Cost Reduction
Get started free and see Grepr in action in 30 minutes.
