Events
Three Weeks, Three Conferences, One Clear Message About Observability Costs
.gif)
We attended KubeCon, AWS re:Invent, and Gartner's IT Infrastructure conference over the past few weeks. The same cost concerns came up at all three.
At KubeCon's 10th anniversary, the OpenTelemetry sessions had standing room only. Teams are standardizing collection methods because vendor pricing varies wildly across hosts, metrics, logs, and traces. Pipeline inefficiencies now translate directly to budget overruns.
The Ingress NGINX retirement (used in nearly half of all Kubernetes clusters) added migration planning to already stretched budgets. (O'Reilly KubeCon Recap)
Re:Invent centered on agentic AI. AWS unveiled Graviton5 processors, Trainium3 UltraServers, frontier agents, and the Nova model family. All powerful technology, but the subtext remained constant: AI infrastructure demands observability, and that observability must scale economically.
One observation from the week captured the tension perfectly: "Nobody wants to be Datadog's number one customer." Being the top spender on any observability platform signals a data strategy problem, not a success metric.
AWS positioned CloudWatch updates around predictable costs and integrated data management rather than feature sprawl. The message: as AI infrastructure scales, observability needs to scale economically alongside it.
The Gartner conference drew 4,000 attendees focused on strategic decisions and budget justification. Paul Delory and Autumn Stanish's opening keynote highlighted that 52% of CIOs list cost-cutting as their top 2026 priority, with AI positioned as the enabler.
Nathan Hill's presentation identified misalignment between infrastructure heads and CIOs as the primary I&O challenge. For observability, this disconnect typically results in collecting data that serves no business purpose while missing signals stakeholders actually need.
Teams collect far more data than they analyze. Secoda's research found 80% of log data provides no analytical value, yet companies pay to ingest, store, and query it anyway. (Source)
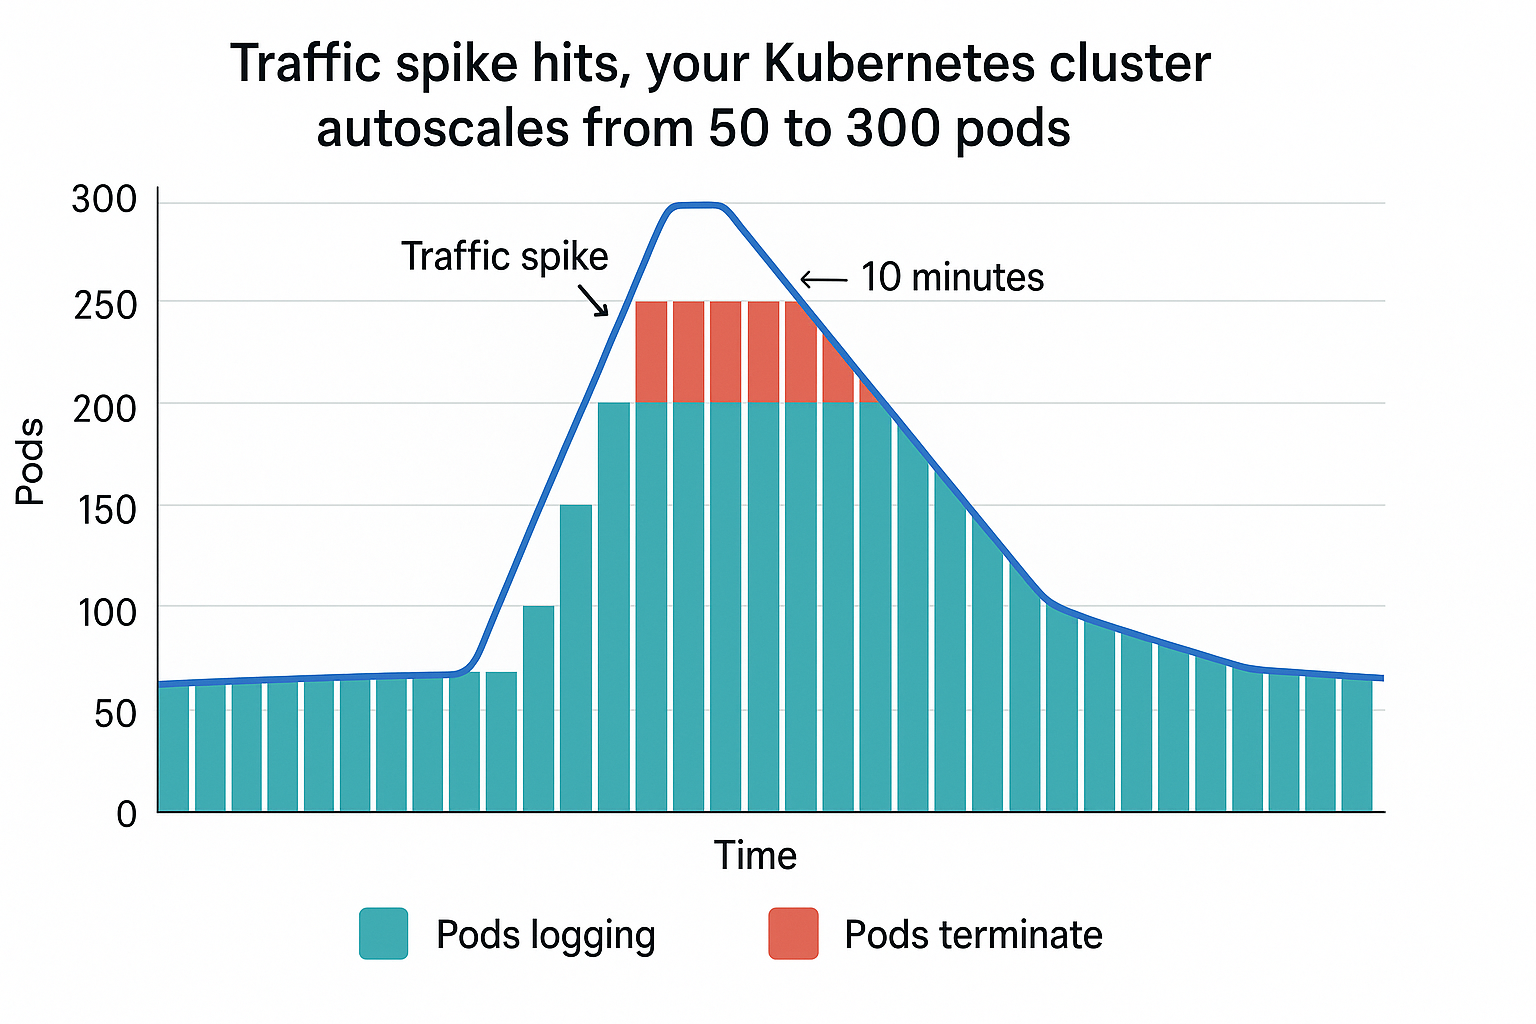
Here's what that looks like: a traffic spike hits, your Kubernetes cluster autoscales from 50 to 300 pods. Each new pod starts logging. Ten minutes later the spike ends, pods terminate, but you've already paid to ingest and index logs from 250 containers that no longer exist. Repeat daily.
Storage costs climb. Teams add more tools to manage costs. You end up running 10+ monitoring platforms. Vendors charge by volume. Your volumes grow exponentially.
Stop collecting everything by default. OpenTelemetry standardizes how you collect data, but you still decide what to keep. Intelligent sampling, storage tiering, and selective retention cut costs by 60-80% according to multiple vendors at the conferences. (Source)
Justify your observability spend. 54% of IT decision-makers now face pressure from leadership to explain observability costs. Source) Only 17% view it as a growth investment; the remaining 70% focus on optimization.
Focus on signals that matter. Platform teams that enforce data collection standards save money while improving incident response. Keep high-fidelity telemetry for critical paths. Sample aggressively everywhere else.
The "collect everything" approach worked when data was cheap and budgets were unlimited. Both conditions have ended. Observability pipelines, intelligent sampling, and adaptive telemetry are table stakes now.
Your observability strategy needs to answer:
Build these decisions into your collection layer from the start. Retrofitting cost controls after you're already paying for petabytes of low-value logs doesn't work.
Ready to optimize observability and reduce your costs while improving visibility? Grab a free demo to get your team started with observability that prioritizes signal over noise.