
.png)
New Relic Pipeline Control Gateway is part of the New Relic Control suite of products that provides a centralised control mechanism for agents and pipelines, it was first released in April 2025. The suite of tools consists of:
- Agent Control: A lightweight supervisor component that manages New Relic and New Relic distribution of OpenTelemetry agents. It communicates with Fleet Control to remotely configure, update, and monitor the health of infrastructure-level instrumentation.
- Fleet Control: A centralised interface that provides visibility and remote management of all supervised agents across the infrastructure. It enables teams to install, configure, monitor and upgrade agents at scale.
- Pipeline Control: The data management component of New Relic Control that helps filter and discard low-value data prior to database ingestion.
It is the Pipeline Control component of the suite that is the subject of this review. It has a similar goal to Grepr of managing data volume before ingestion and indexing at the backend to control costs.
New Relic Pipeline Control
New Relic is a long established vendor in the APM / Observability marketplace, they have been in the leaders of the Gartner Magic Quadrant since 2012. The capabilities of their observability platform covers most, if not all, use cases for digital experience monitoring. Within that broad set of capabilities, Pipeline Control is a relatively new addition. It is designed to process observability data at the edge before incurring egress, ingestion and indexing charges. However, there is a separate cost charged based on the volume of data received by the pipeline. New Relic also offers Cloud Rules which is a pre-processing of data on the New Relic backend before ingestion and indexing; this is charged by the volume of data dropped. The two data processing capabilities can be used simultaneously.
Grepr
Grepr Intelligent Observability Data Engine uses AI to continuously analyse observability data streams to automatically identify similar patterns in the data. Frequently occurring data is summarised while unique data is passed straight through. For example health check requests will be summarised while an error message will be passed through. No data is lost when summarised because all data received by Grepr is retained in low cost storage for compliance and/or later use. The Grepr Intelligent Observability Data Engine currently operates on log and trace data, support for metrics will be available in the future.
Comparison
New Relic Pipeline Control is built on the Open Telemetry Collector with integration supporting central configuration via the New Relic web dashboard. This explains the limited processor capabilities available.
Grepr is primarily focused on analysis of observability data streams to automatically optimize the volume of data sent to observability platforms. Consequently increasing the signal to noise ratio and controlling platform costs. Existing workflows, dashboards, health rules, etc. remain on the incumbent observability platform.
Installation
New Relic Pipeline Control is installed on the customer’s own Kubernetes instance using a Helm chart. Additionally a load balancer should be installed and configured in front of the Pipeline Control. Some sizing consideration and planning should be performed before installation and configuration is attempted. Once the Pipeline Control is running and verified, the New Relic and/or OTel agents will need to be reconfigured to send their data to the Pipeline Control load balancer endpoint.
Grepr fits in like a shim between the existing observability agents and the platform. The existing agents are reconfigured to send the data to Grepr where it will be processed before being forwarded to the observability platform. This is not really an installation, just a small reconfiguration of an existing install with minimal impact on the targeted hosts.
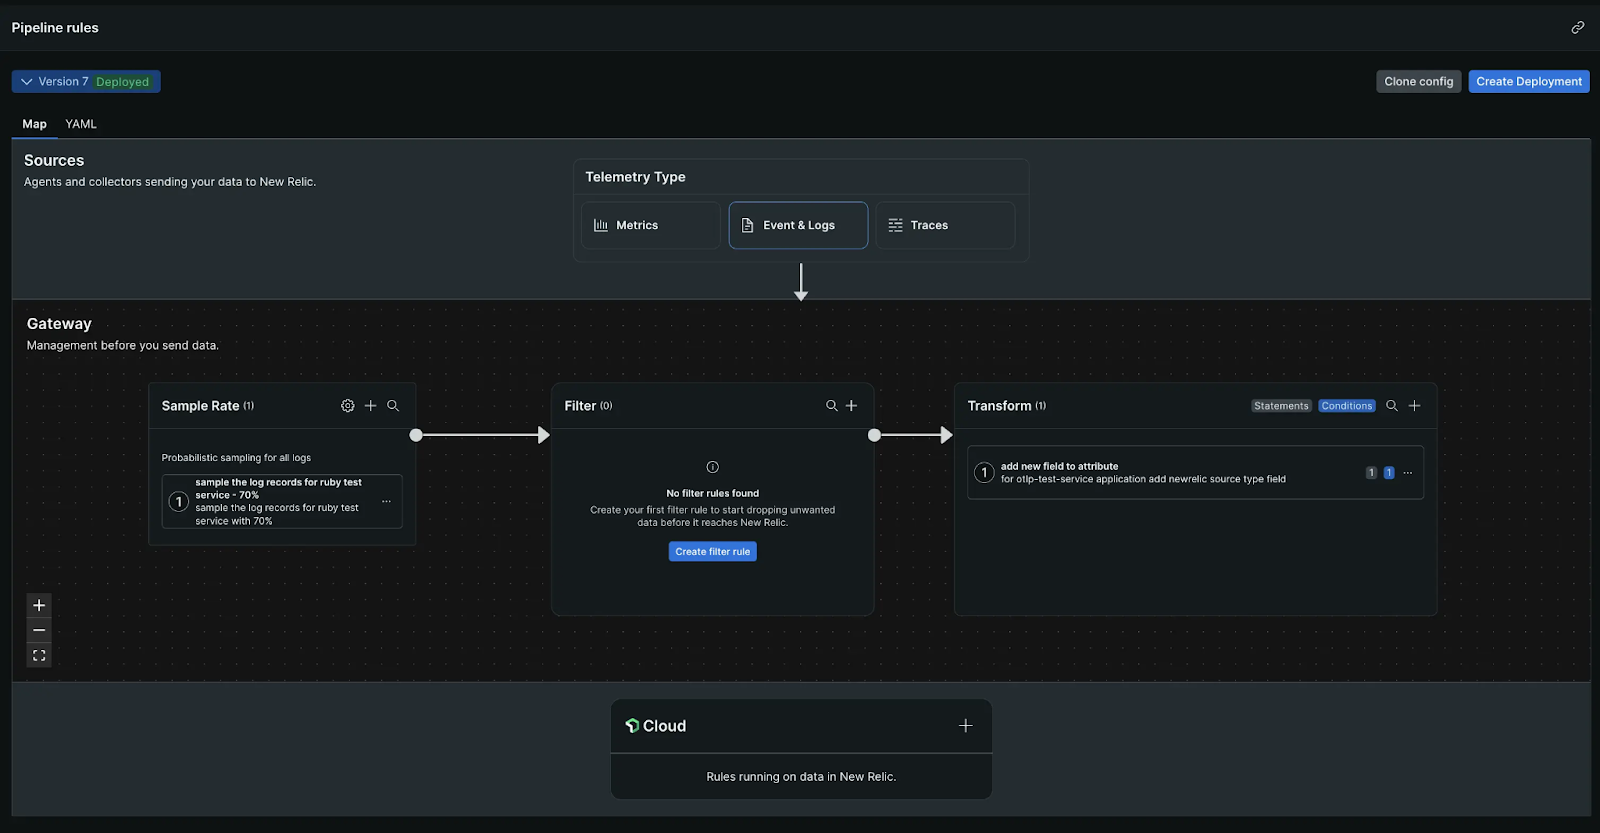
Pipeline Configuration
New Relic Pipeline Control configuration is entirely manual, performed either through the UI on the web dashboard or directly with YAML files. Multiple processors may be daisychained to sample, filter and transform the data as it passes through the pipeline. Each Pipeline Control Gateway can run three simultaneous pipelines, one each for metrics, logs and traces. If there is a requirement to process data differently for other environments/zones then a separate installation of the Pipeline Control is required. Each processor is statically configured and will potentially have to be reconfigured to accommodate new deployments and changes to the monitored application environment.
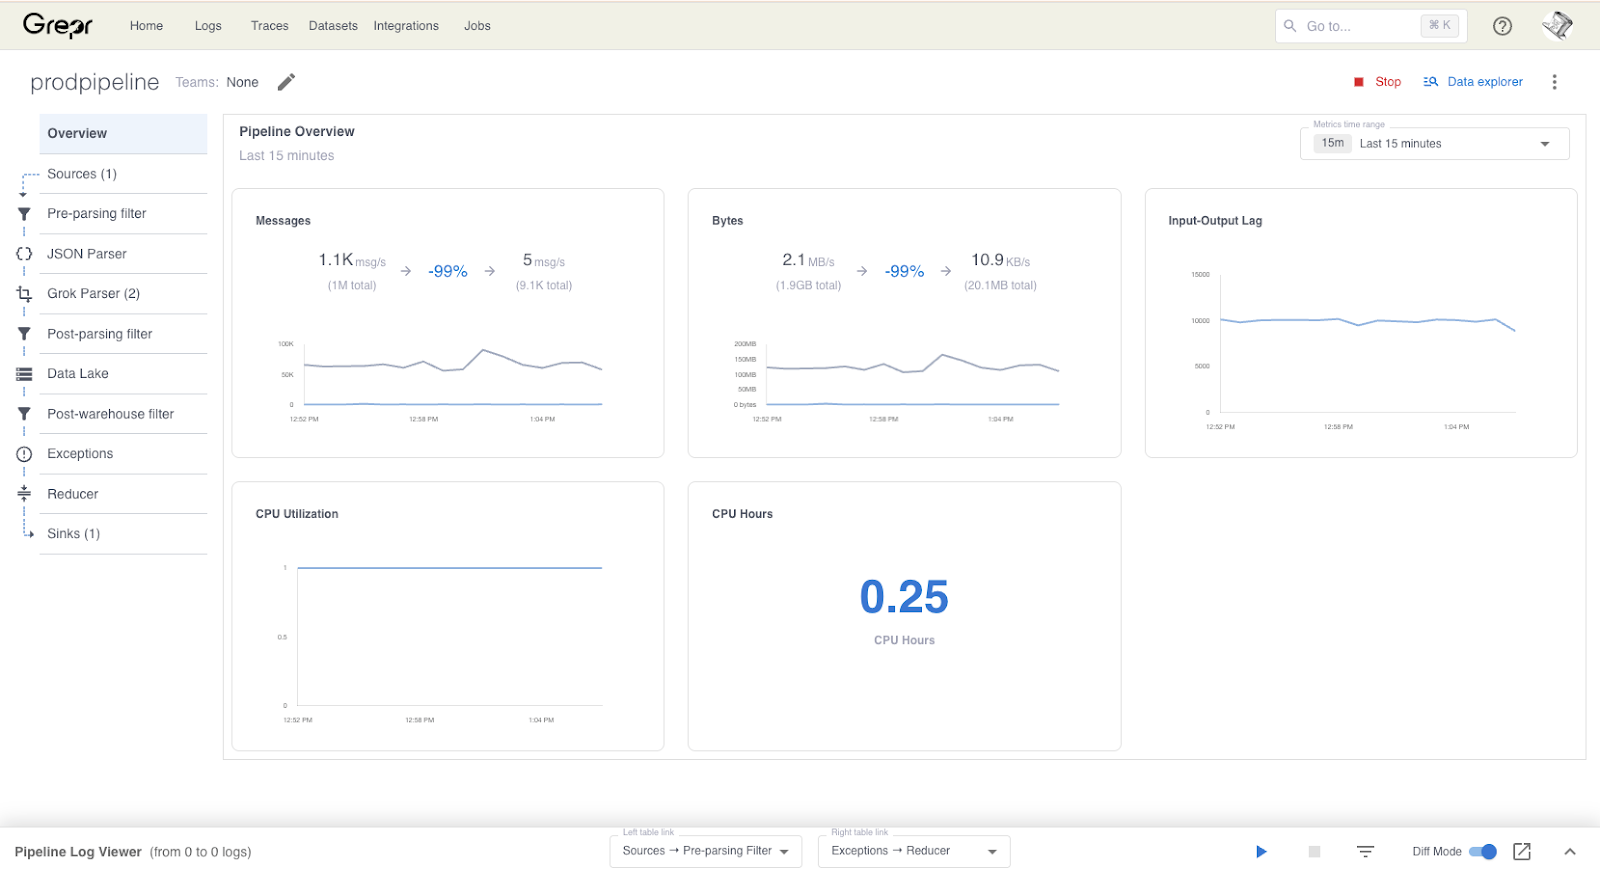
Grepr pipeline configuration is considerably more automated. The pipeline source, sink and data store are configured manually, after that the Grepr takes over. It automatically manages a working set of semantic pattern trackers reducing the data volume by 90% or more. All data received by Grepr is automatically retained in low cost storage for potential use later. Grepr supports multiple pipeline configurations for different environments/zones on a single instance.
Rehydration / Backfill
It is possible to manually configure New Relic Pipeline Control to write all received data to low cost storage such as AWS S3. However, there is currently no way of replaying a selected subset of that data back into New Relic to assist in root cause analysis. Federated Logs which is currently available in preview may change that; no further information is available at the time of writing.
Grepr provides the ability to run a query against the retained data using any of the popular syntaxes (Datadog, NewRelic, Splunk) and time period. Once the query is validated it may be submitted as a backfill job. A more typical use case is to have the backfill triggered automatically via an alert from the observability platform. Grepr can receive a web hook to trigger a targeted backfill.
Time To Value
New Relic Pipeline Control will take longer to install and configure due to requiring a Kubernetes install together with end to end manual configuration for the pipeline. Additional pipelines require an additional Kubernetes install. Ongoing maintenance of processor rules for each pipeline will take additional time and resource requirements. Optimisation levels on the data will be lower due to requiring ongoing manual configuration.
Grepr is easier and quicker to configure. There is negligible impact on engineer productivity because existing workflows will continue to be used without disruption. Productivity should increase as a result of the improved signal-to-noise ratio in the observability data, making it easier to find important log messages and non-optimal traces. Optimisation levels on the data of 90% or more are readily achievable due to the AI continuously managing the working set of semantic filters; approximately 200,000 for high data volume pipelines.
Summary
Pipeline Control is a useful addition to the New Relic platform. It provides a tighter integration between the open source OTel Collector pipeline and the New Relic platform. It provides a general purpose toolkit for limited data filtering and enhancement together with the possibility to route data to different locations, including low cost storage. However, currently there is no support for rehydration or backfill from low cost storage.
Grepr is focused on data optimisation for observability platforms, reducing data volumes by 90% or more while retaining 100% visibility. Additionally providing targeted backfill of data triggered by observability alerts.
Both solutions have pipeline processing and routing at their core. The superior AI automation of Grepr for managing the optimisation rules along with the minimal initial installation requirements makes Grepr the better choice.
Ready To See The Difference?
For teams that want observability cost control without overhauling existing workflows, Grepr delivers results from day one. There's no complex installation, no manual pipeline maintenance, and no second dashboard competing for your engineers' attention.
Your existing agents, dashboards, and alerting rules stay exactly where they are. Grepr works alongside them, automatically optimizing data volume while retaining everything in low-cost storage for when you need it.
Schedule a demo to see how Grepr's Intelligent Observability Data Engine can reduce your observability costs by 90% or more, with zero disruption to your current workflows.
Frequently Asked Questions
What is New Relic Pipeline Control and how does it work?
New Relic Pipeline Control is a data preprocessing component released in April 2025 as part of the New Relic Control suite. It sits on a customer-managed Kubernetes cluster and processes observability data before it reaches the New Relic backend. The pipeline runs on the OpenTelemetry Collector under the hood, which is why the processor options are limited to what OTel supports natively. Configuration is manual, through either the web dashboard or YAML files. Each gateway instance runs three parallel pipelines, one for metrics, one for logs, one for traces, and supports no more than three environments per install. If your infrastructure spans multiple zones with different filtering needs, you need separate installs.
Is New Relic Pipeline Control worth it for cost reduction?
It depends on how much engineering time you have to maintain it. Pipeline Control does reduce what reaches the New Relic ingestion layer, which can lower costs, but the compression efficiency is low relative to the maintenance overhead. Processors require manual configuration, and they need ongoing updates as your application environment changes. There's also a separate charge based on data volume received by the pipeline itself. For teams with significant log and trace volume, the manual upkeep tends to become a part-time job, and the filtering rules rarely keep pace with how fast modern services generate data.
How is Grepr different from New Relic Pipeline Control?
The main difference is how filtering decisions get made. New Relic Pipeline Control requires an engineer to write and maintain processor rules. Grepr uses AI to analyze the data stream continuously and build its own set of semantic filters, typically managing around 200,000 patterns for high-volume pipelines. The practical result is a roughly 90% reduction in data volume without touching your existing dashboards, alerts, or agent configuration. Grepr also stores everything it receives in low-cost object storage, so nothing is permanently discarded. New Relic Pipeline Control can be configured to write to S3, but there's no native way to replay that data back into New Relic for investigation.
Does New Relic Pipeline Control support data rehydration or backfill?
Not currently. You can configure it to archive data to low-cost storage like AWS S3, but there's no supported path to replay a specific subset of that data back into New Relic when you need it for root cause analysis. A feature called Federated Logs is in preview as of this writing, but no further details are available. Grepr handles this differently. It accepts incoming webhooks from your observability platform, so an alert can automatically trigger a targeted backfill of the relevant time window and log pattern. You can also run ad hoc queries against retained data using Datadog, New Relic, or Splunk query syntax.
Can I use New Relic Pipeline Control with non-New Relic observability platforms?
Technically yes, since it's built on the OpenTelemetry Collector, which supports multiple destinations. In practice it's designed for use within the New Relic ecosystem and integrates tightly with Fleet Control and Agent Control for centralized management. If you're sending data to Datadog, Splunk, or another platform, you'd be running a generic OTel Collector setup without the management layer that makes Pipeline Control worth the Kubernetes overhead. Grepr is platform-agnostic by design. It sits between your existing agents and whatever observability backend you use, and supports query syntax from multiple platforms for backfill operations.
How long does it take to deploy Grepr vs New Relic Pipeline Control?
New Relic Pipeline Control requires a Kubernetes install, load balancer configuration, sizing decisions before deployment, and full end-to-end pipeline configuration before any data flows through it. Additional environments require additional installs. Grepr is a configuration change to your existing agents, not a new infrastructure component. You're pointing existing agents at Grepr instead of directly at your observability platform, which takes minutes. The AI starts learning your data patterns immediately, and meaningful volume reduction typically begins on day one.
What happens to filtered data in Grepr? Is anything permanently lost?
Nothing is discarded. Grepr retains all received data in low-cost object storage regardless of how it's processed. Frequently recurring patterns like health check requests get summarized rather than forwarded in full. Unique events, errors, and anomalies pass through without modification. The summarized data is still available in storage and can be queried or rehydrated on demand. This is a meaningful distinction from traditional pipeline filtering tools, where data that gets dropped is gone permanently.
More blog posts
All blog posts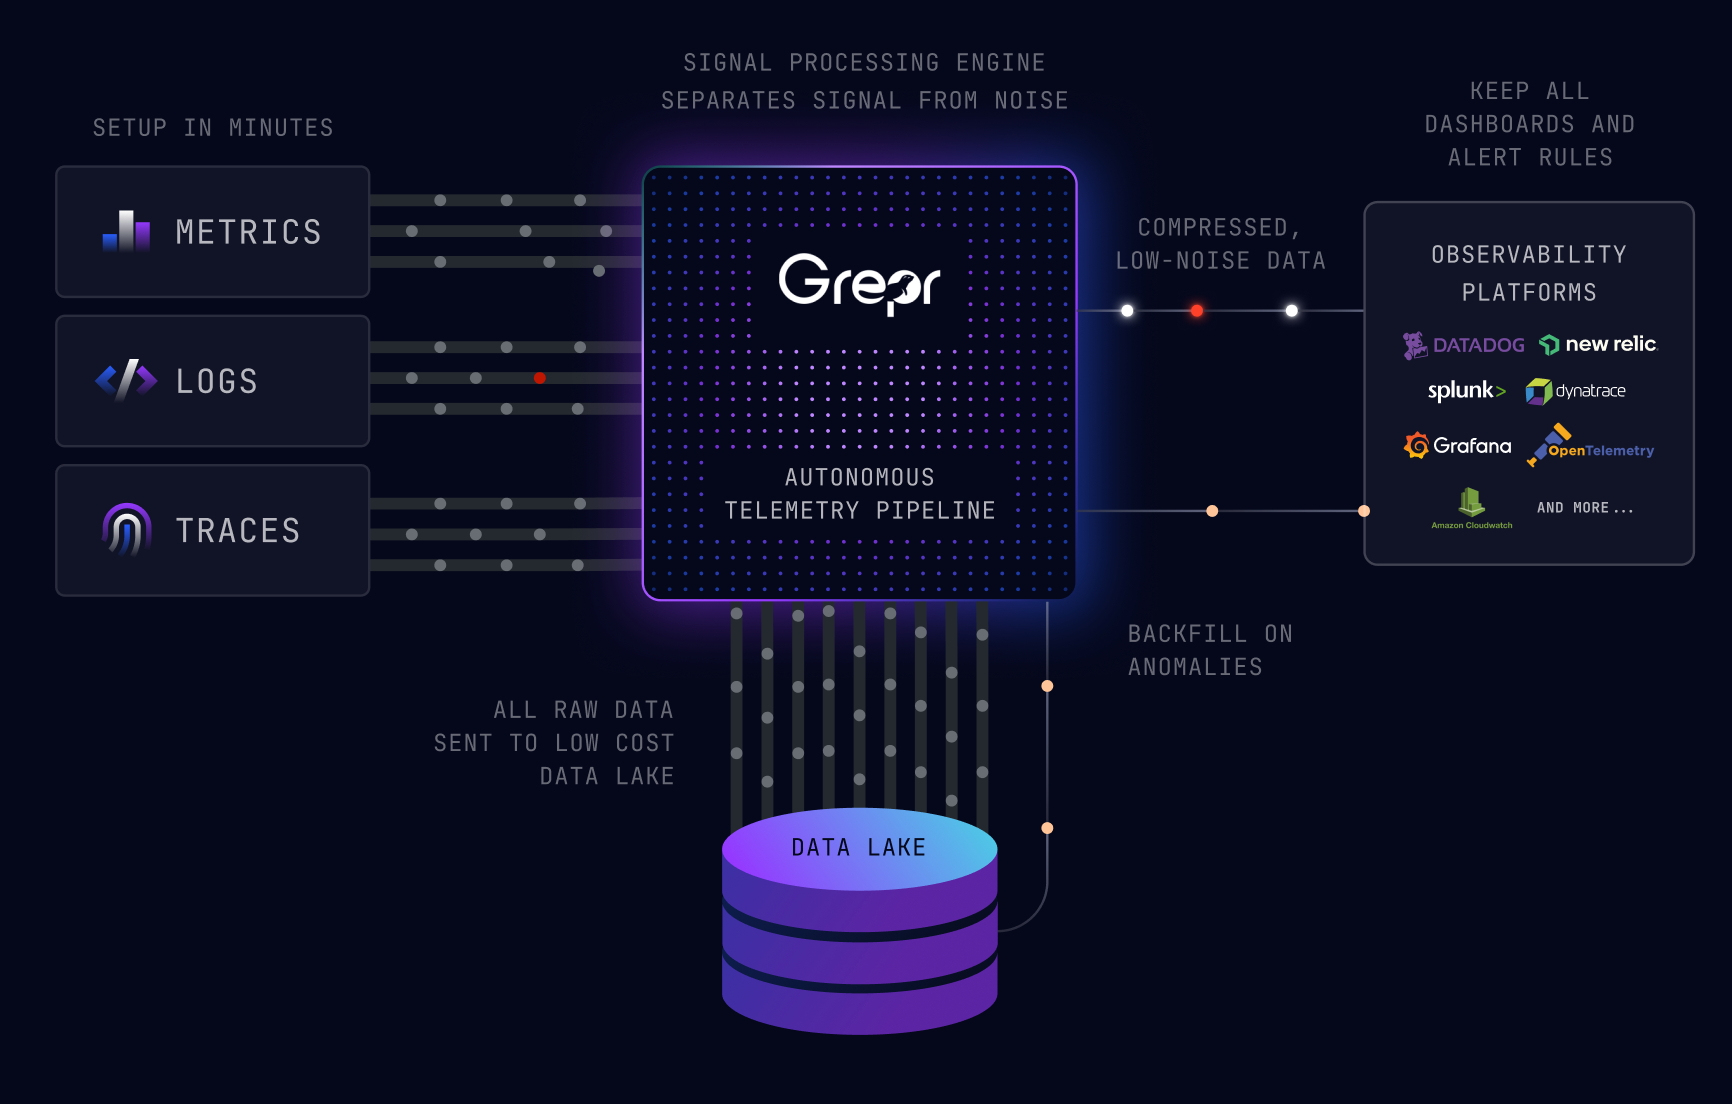
Grepr Just Launched a Free Tier: Reduce telemetry noise by 90%

Grepr Wins the 2026 Intellyx Digital Innovator Award for Observability Cost Reduction

What We Heard at Observability Summit 2026
Get started free and see Grepr in action in 30 minutes.
