Product Features
Using Grepr With Grafana Cloud

Grafana Cloud bills by log volume. Grepr reduces that volume by up to ninety percent with a simple configuration change. You need no new agents. Your workflows stay unchanged. All raw data is retained.
Whether you use Grafana Alloy or OpenTelemetry collectors, the setup is the same. Point your shipper at Grepr instead of Grafana Cloud. Grepr uses semantic machine learning to identify repetitive patterns across your logs. Frequently occurring messages are aggregated and sent to Grafana as summaries with guaranteed samples. Unique events pass through unchanged.
Every raw log is stored in low cost object storage. You can query it directly or trigger selective backfills during incidents.
Full details are in the Grepr documentation. Here's the workflow.
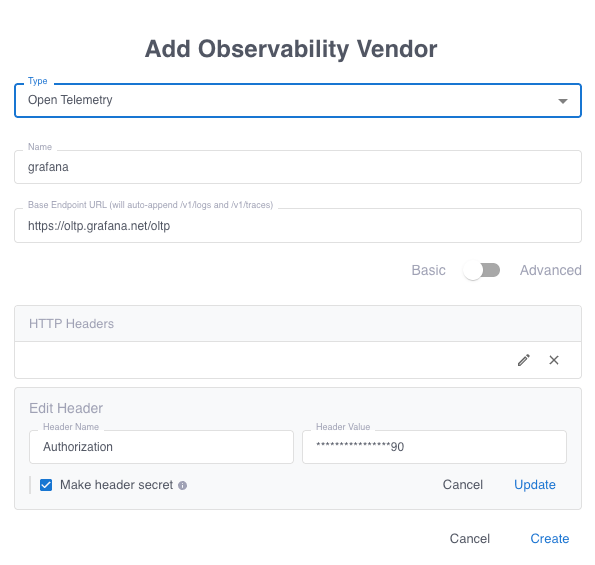
Use the Grepr dashboard to create an OpenTelemetry integration for Grafana. This defines your sink.
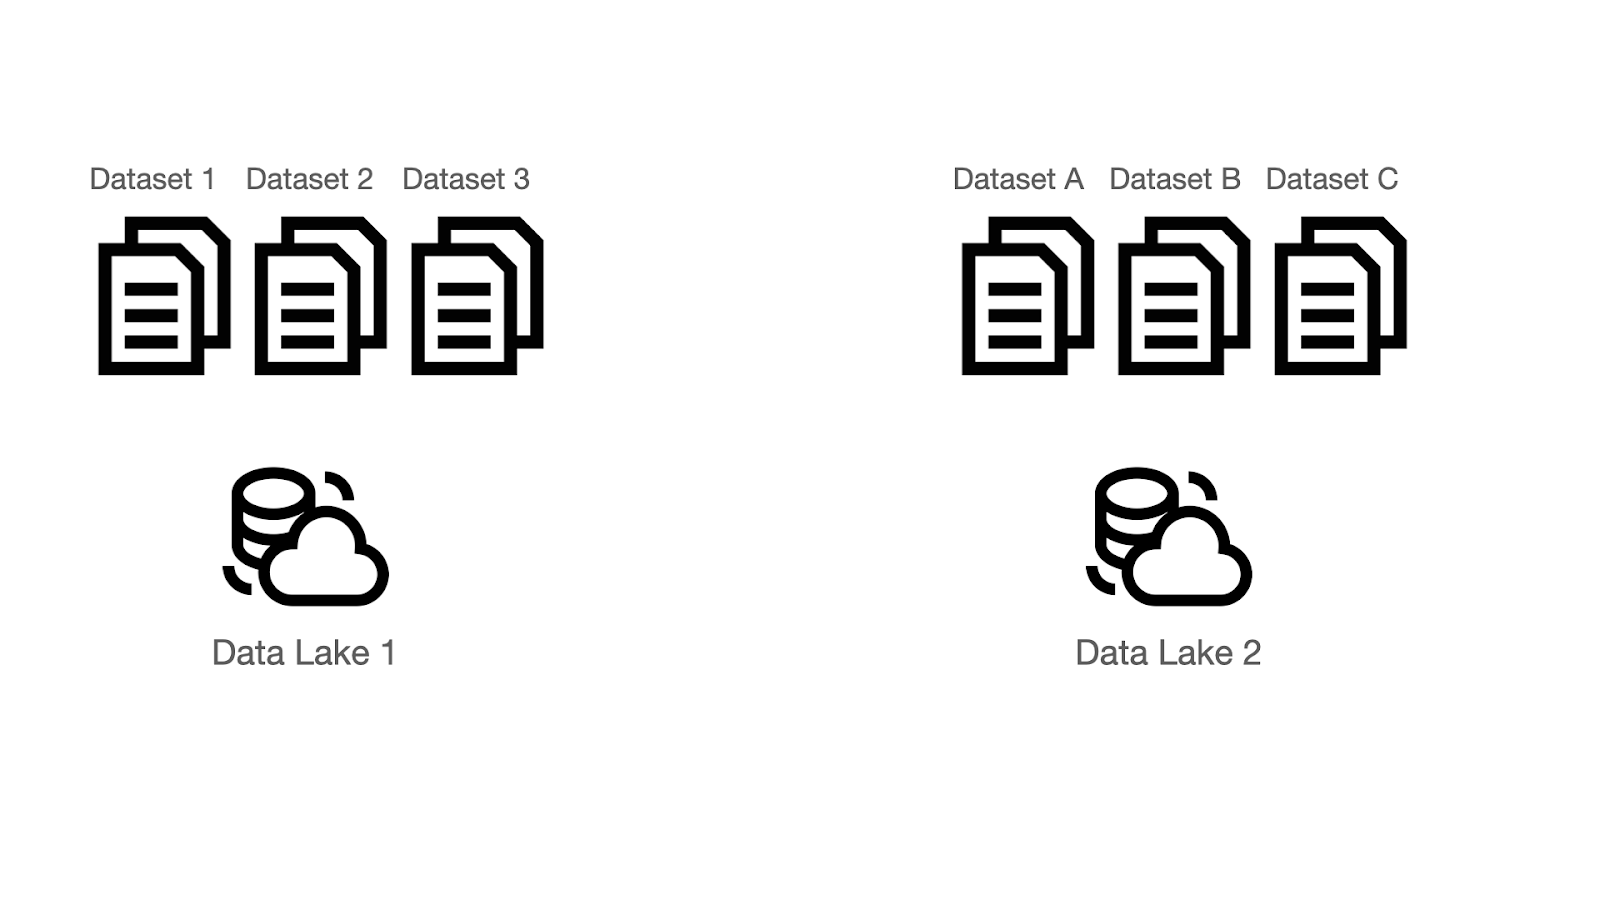
Grepr stores all raw telemetry in S3 compatible buckets using Parquet and Iceberg formats. You can use a Grepr managed bucket or bring your own. Create a bucket in the dashboard, then add a dataset inside it. Each pipeline uses one dataset for retention.
Create a pipeline in the dashboard. Set the integration as both source and sink. Attach the dataset for storage. The pipeline generates a unique endpoint URL.
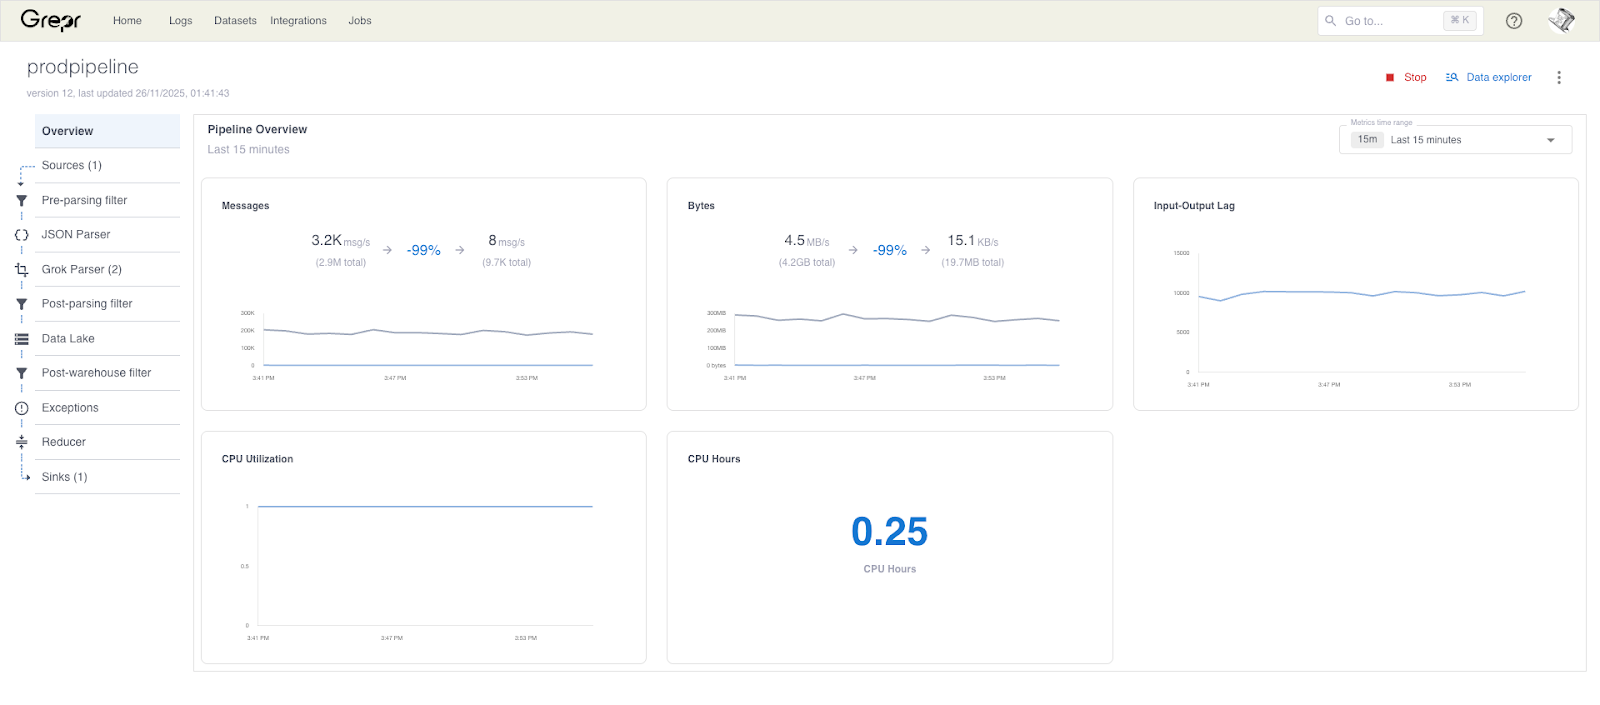
Reconfigure your log shippers to send data to the Grepr endpoint. The dashboard shows message throughput and volume reduction in real time.
Grepr reduces log volume by ninety percent or more at ingest. Your Grafana dashboards and alerts continue working without changes. No disruption to engineering workflows. No manual tuning required.
All raw logs remain queryable in your data lake. Backfills happen automatically during incidents to restore missing context.
Point your shippers at Grepr and watch volume drop. You keep full visibility with a fraction of the cost.
Do I need to install new agents to use Grepr with Grafana Cloud?
No. You reconfigure your existing log shippers to point at Grepr instead of Grafana Cloud. Grafana Alloy and OpenTelemetry collectors work without modification. You update the destination endpoint and Grepr handles the rest.
What happens to my Grafana dashboards and alerts when I switch to Grepr?
They continue working without changes. Grepr parses your existing dashboards and alerts to identify required data. That data passes through unchanged. Aggregation only affects repetitive patterns that are not feeding your monitoring workflows.
Can I search for specific transaction IDs or error messages after Grepr reduces log volume?
Yes. Grepr stores every raw log in your S3 compatible bucket using Parquet and Iceberg formats. You can query the complete dataset using your preferred query language. Grepr supports SPL, Lucene syntax, Datadog syntax, and NRQL. Backfills happen automatically during incidents to restore missing context.
How much will Grepr actually reduce my Grafana Cloud bill?
Volume reduction typically reaches ninety percent or more. Your exact savings depend on your log patterns. Services with high repetition see the largest reduction. Unique events and low noise logs pass through at full volume. You can dual ship during testing to measure reduction before committing.
Does Grepr slow down log ingestion or add latency to my pipeline?
No. Grepr processes logs in real time at the edge of your pipeline. Reduced logs flow to Grafana Cloud immediately. Raw logs write to object storage in parallel. Your alerting and troubleshooting workflows maintain the same speed they have today.