Engineering Guides
Grepr for Kubernetes Environments: Architecture and Implementation
.png)
Kubernetes clusters don't generate telemetry so much as they flood it. Container stdout/stderr, control plane audit logs, ingress controller access logs, sidecar proxy traces, node-level system logs, all of it arriving continuously in your processing pipelines.
A 200 pod cluster can hit hundreds of gigabytes per day without anything going wrong, which means today’s log events look the same as yesterday's log events. The same healthcheck responses, the same successful request patterns, the same scheduled job outputs firing around the clock. Your observability platform indexes all of it and charges you accordingly. Not only are you paying to store all this redundant data, but you also face the challenge of finding important signals among all the noise.
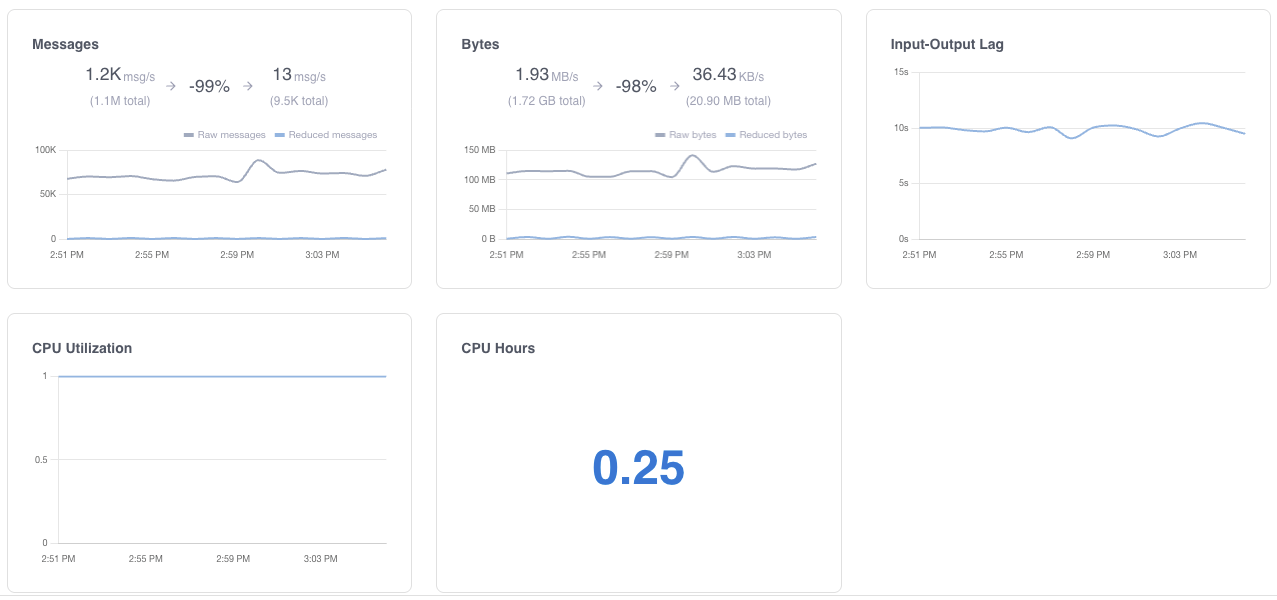
Grepr solves these challenges by removing the noise and significantly reducing the data volumes sent to your observability vendor’s platform. Instead of forwarding log events from the Kubernetes log shippers directly to the observability platform, you configure them to send the logs to Grepr. The Grepr platform processes log events using semantic machine learning to reduce the volume of data forwarded to your observability platform by up to 90 percent, while preserving all raw log events in low-cost Amazon S3 storage.
No new agents on your nodes. No sidecars. No application code changes. You update the destination in your existing shipper configuration, and Grepr handles the rest.
Grepr's machine learning engine reads the incoming stream and starts grouping events by semantic patterns. Lines that differ only in timestamps, request IDs, or other variable fields get treated as the same pattern. One representative sample from each group passes through to your backend, the rest stays in low cost storage.
In Kubernetes environments, the patterns that drive the most volume are predictable:
Kubernetes probes fire every few seconds per pod. The success responses are identical every time. Grepr aggregates these automatically.
The vast majority of web requests to a service look the same in the logs: the same endpoint, the same status code, the same response time range. The outliers (errors, slow responses, unusual paths) are the signal. Grepr preserves those.
Cron jobs are a good example. A job that runs every five minutes and succeeds produces the same output every time. Grepr forwards a sample and stores the rest. When something actually fails, that line looks different enough that it passes through unchanged.
The Kubernetes control plane, ingress controllers, service meshes, and operators all produce verbose output during normal operation. Most of it is routine reconciliation.
Grepr's semantic aggregation and signature-based sampling are enabled out of the box. The ML engine starts identifying patterns within minutes of receiving data.
During the initial period, Grepr learns your log patterns. Reduction rates increase as the engine builds confidence in pattern classification. Most environments reach peak reduction within a few hours.
Run Grepr alongside your existing direct pipeline during the rollout. Ship logs to both Grepr and your backend simultaneously. Compare what arrives at your backend from each path. Verify that your dashboards, alerts, and queries produce the same results from the reduced dataset.
Once confident, disable the direct pipeline. Grepr becomes the sole path.
Grepr provides controls for tuning reduction behavior. You can set per-service or per-namespace exception rules (logs that should always pass through without reduction), adjust sampling rates for specific pattern groups, and define custom routing rules.
When using Grepr with Datadog or New Relic observability platforms, logs used in monitors and/or dashboard metrics can be automatically excluded.
Most teams find the default ML-driven reduction works well out of the box.
Alerts and dashboards continue to work. Troubleshooting workflows stay the same for active incidents. Anomalous events, errors, and unique log lines pass through unchanged. For historical investigation, the full raw dataset is searchable in your S3 bucket using Grepr's query interface or standard tools like Athena, DuckDB, or Trino.
The operational difference is your observability bill. Teams running Grepr in Kubernetes environments typically see 70 to 90 percent volume reduction at the pipeline level. The exact number depends on how repetitive your workload's log output is, but Kubernetes environments tend toward the higher end because of probe logs, controller chatter, and replicated service output.
What is the best way to reduce log volume in Kubernetes?
The approaches that actually move the needle are semantic aggregation and pattern-based sampling, not simple filtering rules. Simple rules require you to know in advance what's repetitive. In a Kubernetes environment, the patterns shift constantly as services deploy and scale, so static rules need constant maintenance to stay effective. Semantic aggregation works differently: it analyzes the content of log events and identifies structurally similar lines automatically, aggregating probe responses, routine HTTP access logs, and scheduled job output without you having to define each pattern. Grepr does this at the pipeline level between your DaemonSet agent and your observability backend, so your existing dashboards and alerts aren't affected.
Does Grepr require new agents or sidecars in my Kubernetes cluster?
No. The only change is updating the output destination in your existing DaemonSet agent configuration, whether that's Fluent Bit, Fluentd, Vector, or the OpenTelemetry Collector. You point it at Grepr instead of directly at your observability backend. No new DaemonSets, no sidecars, no application code changes. For most teams the config change takes under 20 minutes.
What types of Kubernetes logs generate the most volume?
Healthcheck and readiness probe responses are usually the biggest contributor. Kubernetes fires probes every few seconds per pod, and in a 200-pod cluster the successful responses are nearly identical every time. Routine HTTP access logs run a close second, particularly for services with steady traffic where the overwhelming majority of requests share the same endpoint, status code, and response time range. Control plane logs, ingress controller output, and scheduled job results are also consistently high-volume and low-signal in normal operation. These are exactly the patterns Grepr aggregates automatically.
Will reducing log volume affect my dashboards and alerts?
It shouldn't. Grepr passes unique events, errors, and anomalies through unchanged. For the patterns it aggregates, a guaranteed sample still reaches your observability backend, so metric-based dashboards and threshold alerts continue to work. During rollout, Grepr supports a dual-ship mode where logs flow through both Grepr and your existing direct pipeline simultaneously, so you can verify your dashboards and alert rules produce the same results before cutting over.
Where does raw log data go? Is anything permanently lost?
Nothing is discarded. Grepr writes all received events to an S3-compatible bucket you control, in Apache Parquet format with Apache Iceberg table management. The reduced set goes to your observability platform. The full raw dataset sits in your storage for historical investigation, compliance, or rehydration. You can query it with Grepr's interface or standard tools like Athena, DuckDB, or Trino.
Does Grepr work with my existing observability platform?
Grepr supports direct integration with Datadog, Splunk, New Relic, Grafana Cloud, Sumo Logic, and any OpenTelemetry-compatible endpoint. On the input side it accepts HTTP, gRPC, syslog, and platform-specific protocols like Splunk HEC. If your current stack uses any of the major DaemonSet agents, Fluent Bit and the OTel Collector being the most common, the integration is a single config block change.
How long does it take to see volume reduction after deploying Grepr?
The ML engine starts identifying patterns within minutes of receiving data. Reduction rates increase as it builds confidence in pattern classification. Most Kubernetes environments reach peak reduction within a few hours. Because probe logs and controller chatter are so structurally consistent, Kubernetes workloads tend toward the higher end of the 70 to 90 percent range.