

Healthcheck logs are the single largest source of wasted observability spending for most teams. A liveness probe fires, the service responds 200, and a log line is written. That same flow repeats every ten seconds across every pod in your cluster. Your observability platform ingests every copy, indexes it, and bills you for the storage.
The Scale of the Health Check Log Problem
Most teams do not think about health check volume until they pull an invoice. Liveness and readiness probes firing every 10 seconds across 200 pods generate 1.2 million log lines per hour, about 8.6 GB per day at 300 bytes per line. By the end of the year, you are looking at three-plus terabytes of data that has never helped anyone debug anything, billed at the same ingestion rate as the logs that actually matter.
Health Checks are just the most obvious offender. Load balancer pings, status polling endpoints, and keep-alive connections pile on with the same characteristics: they fire constantly, carry almost no information, and your observability platform treats them the same as a stack trace or an error event.
Step 1: Identify Your Health Check Log Patterns
Start by finding out what the noise actually looks like in your environment. Run a frequency analysis on your log stream to surface the most repeated messages. If you use Fluent Bit, The OpenTelemetry Collector, or Vector, you can query the raw stream before it hits your backend.
The usual suspects:
GET /health 200 OK
GET /healthz 200 OK
GET /readyz 200 OK
GET /status 200 OK
GET /ping 200 OK
In Kubernetes, the source IP is usually the kubelet or a load balancer health checker. kube-probe/* and ELB-HealthChecker/* in the User-Agent header are the reliable identifiers. Pull a count of your top 20 most frequent log messages across a 24-hour window. Health check lines will take most of the top slots.
Step 2: Measure Health Check Log Volume Before Filtering
Record total daily log volume in GB before touching anything, then calculate what percentage comes from healthcheck patterns. Most teams find that health check and status endpoint logs account for 15 to 40 percent of total volume. You need those numbers to verify the reduction actually happened.
Step 3: Filter Health Check Logs at the Application Level
The most efficient option is to stop the log line from getting created at all. Most web frameworks let you suppress logging at the route level before anything gets written.
Go (net/http or Gin): Before logging a message, check the request path.. If it matches /health, /healthz, /readyz, or /ping, return the response and skip the logger.
Python (Flask, FastAPI, Django): Attach a before_request handler that sets a flag on health check routes, then check that flag in your logging output before writing.
Node.js (Express): Put a middleware layer before your logger that short-circuits health check routes straight through.
This only works if you own the code and can ship the change. Third-party services, managed components, and anything where the logging stack is not yours to touch will need a different approach.
Step 4: Filter Health Check Logs at the Log Shipper
When application code is off limits, the collection layer is where you catch it. The log line still gets created, but it gets dropped before it leaves the node.
Fluent Bit:
[FILTER]
    Name    grep
    Match   *
    Exclude log GET /health
    Exclude log GET /healthz
    Exclude log GET /readyz
    Exclude log kube-probe
OpenTelemetry Collector:
processors:
  filter:
    logs:
      exclude:
        match_type: regexp
        bodies:
          - "GET /health(z)? (200|HTTP/1\\.1)"
          - "GET /readyz"
          - "kube-probe/.*"
Vector:
[transforms.drop_healthchecks]
type = "filter"
inputs = ["kubernetes_logs"]
condition = '!match(.message, r"GET /health") && !match(.message, r"kube-probe")'
The log line still gets generated at the application, but it gets dropped before leaving the node. That is the tradeoff: shipper-level filtering is available to you even when application code is not.
Step 5: Filter at the Observability Pipeline Level
When you need one rule to cover hundreds of services without touching individual application configs or shipper configurations, filter centrally at the pipeline layer. Tools like Cribl let you define drop rules once and apply them across your entire log stream without per-service configuration.
The tradeoff versus shipper-level filtering is operational: a pipeline filter is one place to maintain, but it is another component in your stack. For teams already running a pipeline, it is the obvious place to put this. For teams that are not, shipper-level filters get you most of the way there.
Step 6: Validate the Results
After deploying your filters, measure against the baseline from Step 2. Most teams see a 15 to 40 percent reduction in total log volume from healthcheck filtering alone. In environments with aggressive probe intervals, the reduction can go higher.
One thing to confirm: your health check alerting still works. You are dropping the success logs, not disabling the probes. If a health check fails, the error response needs to still flow through your pipeline and trigger the appropriate alert. Test that before you call it done.
Going Further: Health Check Logs Are Not the Only Noise
Health Checks are the most obvious place to start. But heartbeat pings, connection keep-alives, routine cron job output, and debug-level logs left on in production are all costing you too. The filtering approach is the same regardless of the pattern. The difference between an observability bill that is under control and one that is not is usually a handful of log categories nobody got around to dropping.
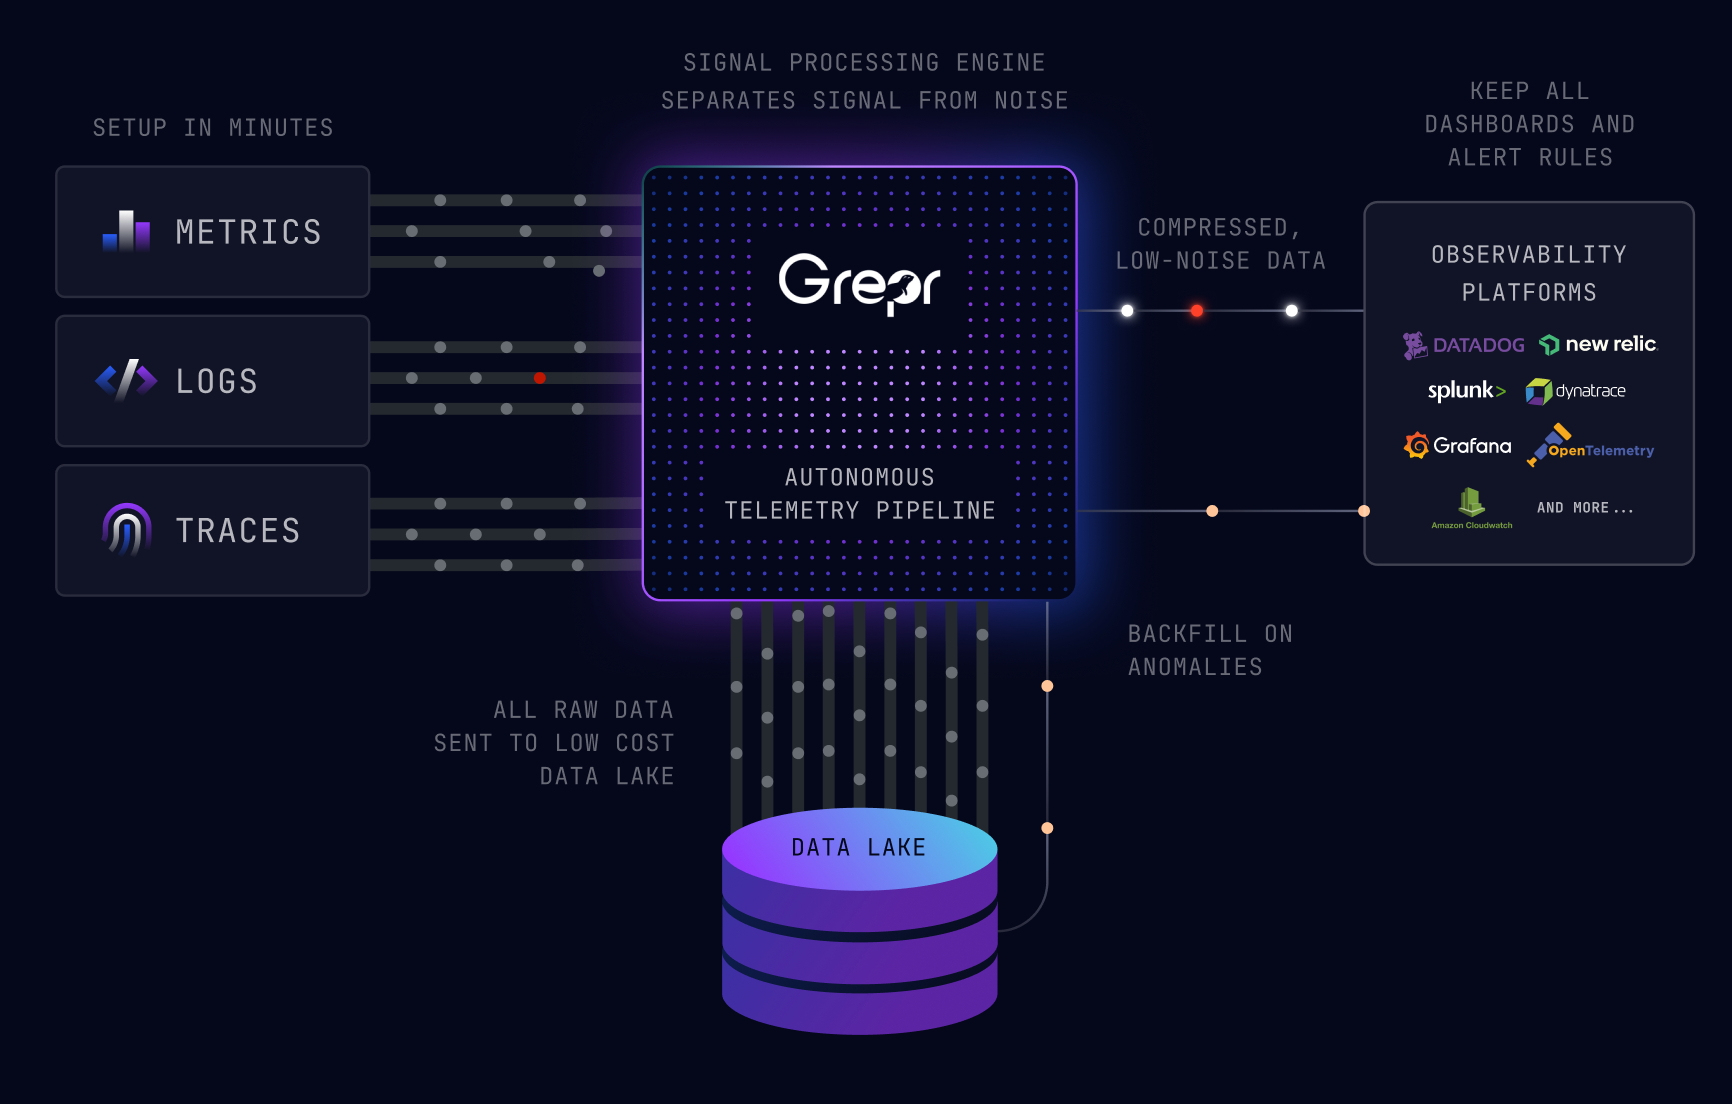
How Grepr Handles This Automatically
Manual filtering gets you a long way. It also means knowing every pattern in advance, maintaining configs across services, and revisiting the whole thing when new noise sources show up. That is fine on a small scale. In environments with dozens of services and frequent deployments, the maintenance overhead starts to outweigh the savings.
Grepr's semantic ML engine runs pattern detection continuously across your log stream. Health checks, keep-alives, polling endpoints, repetitive cron output, it identifies and aggregates them at ingest without requiring you to write rules for each one. Genuinely novel events and anomalies pass through to your existing tools unchanged.
For teams that want to stay hands-on, explicit drop rules and routing configurations are available alongside the automated reduction. The healthcheck noise that accounts for 15 to 40 percent of most teams' log volume stops hitting your ingestion bill either way.
Learn more at grepr.ai.
Frequently Asked Questions
What are healthcheck logs and why do they increase observability costs?
Healthcheck logs are the records generated every time a load balancer, Kubernetes liveness probe, or uptime monitor pings a service endpoint like /health or /healthz. These probes run every few seconds per instance, producing millions of identical log lines per day. Observability platforms charge per GB ingested, so this repetitive, low-information traffic inflates your bill without adding troubleshooting value.
How much log volume do healthcheck endpoints typically generate?
In a Kubernetes cluster with 200 pods running probes every 10 seconds, healthcheck logs alone produce roughly 28.8 million lines per day, or about 8.6 GB. Across most deployments, healthcheck and status endpoint logs account for 15 to 40 percent of total log volume. Environments with aggressive probe intervals or multiple monitoring systems can push that number even higher.
Where is the best place to filter healthcheck logs in the pipeline?
The most efficient place is at the application level, where you suppress logging for healthcheck routes before a log line is ever created. If you cannot modify application code, filter at the log shipper (Fluent Bit, Vector, or OpenTelemetry Collector) using pattern-based exclusion rules. For centralized control across many services, filter at the pipeline level using an observability pipeline tool.
Will filtering healthcheck logs break my uptime monitoring or alerting?
No. Filtering removes the success response logs, not the probes themselves. Kubernetes liveness and readiness probes continue to run normally. If a probe fails, the error response still flows through your pipeline and triggers the appropriate alert. You are only dropping the repetitive "200 OK" lines that confirm what you already know.
What other log patterns should I filter besides healthchecks?
Healthchecks are the most obvious target, but similar high-frequency, low-information patterns include heartbeat pings, connection keep-alive messages, routine cron job success output, polling responses from monitoring agents, and debug-level logs accidentally left enabled in production. The same identification and filtering approach works for all of these.
More blog posts
All blog posts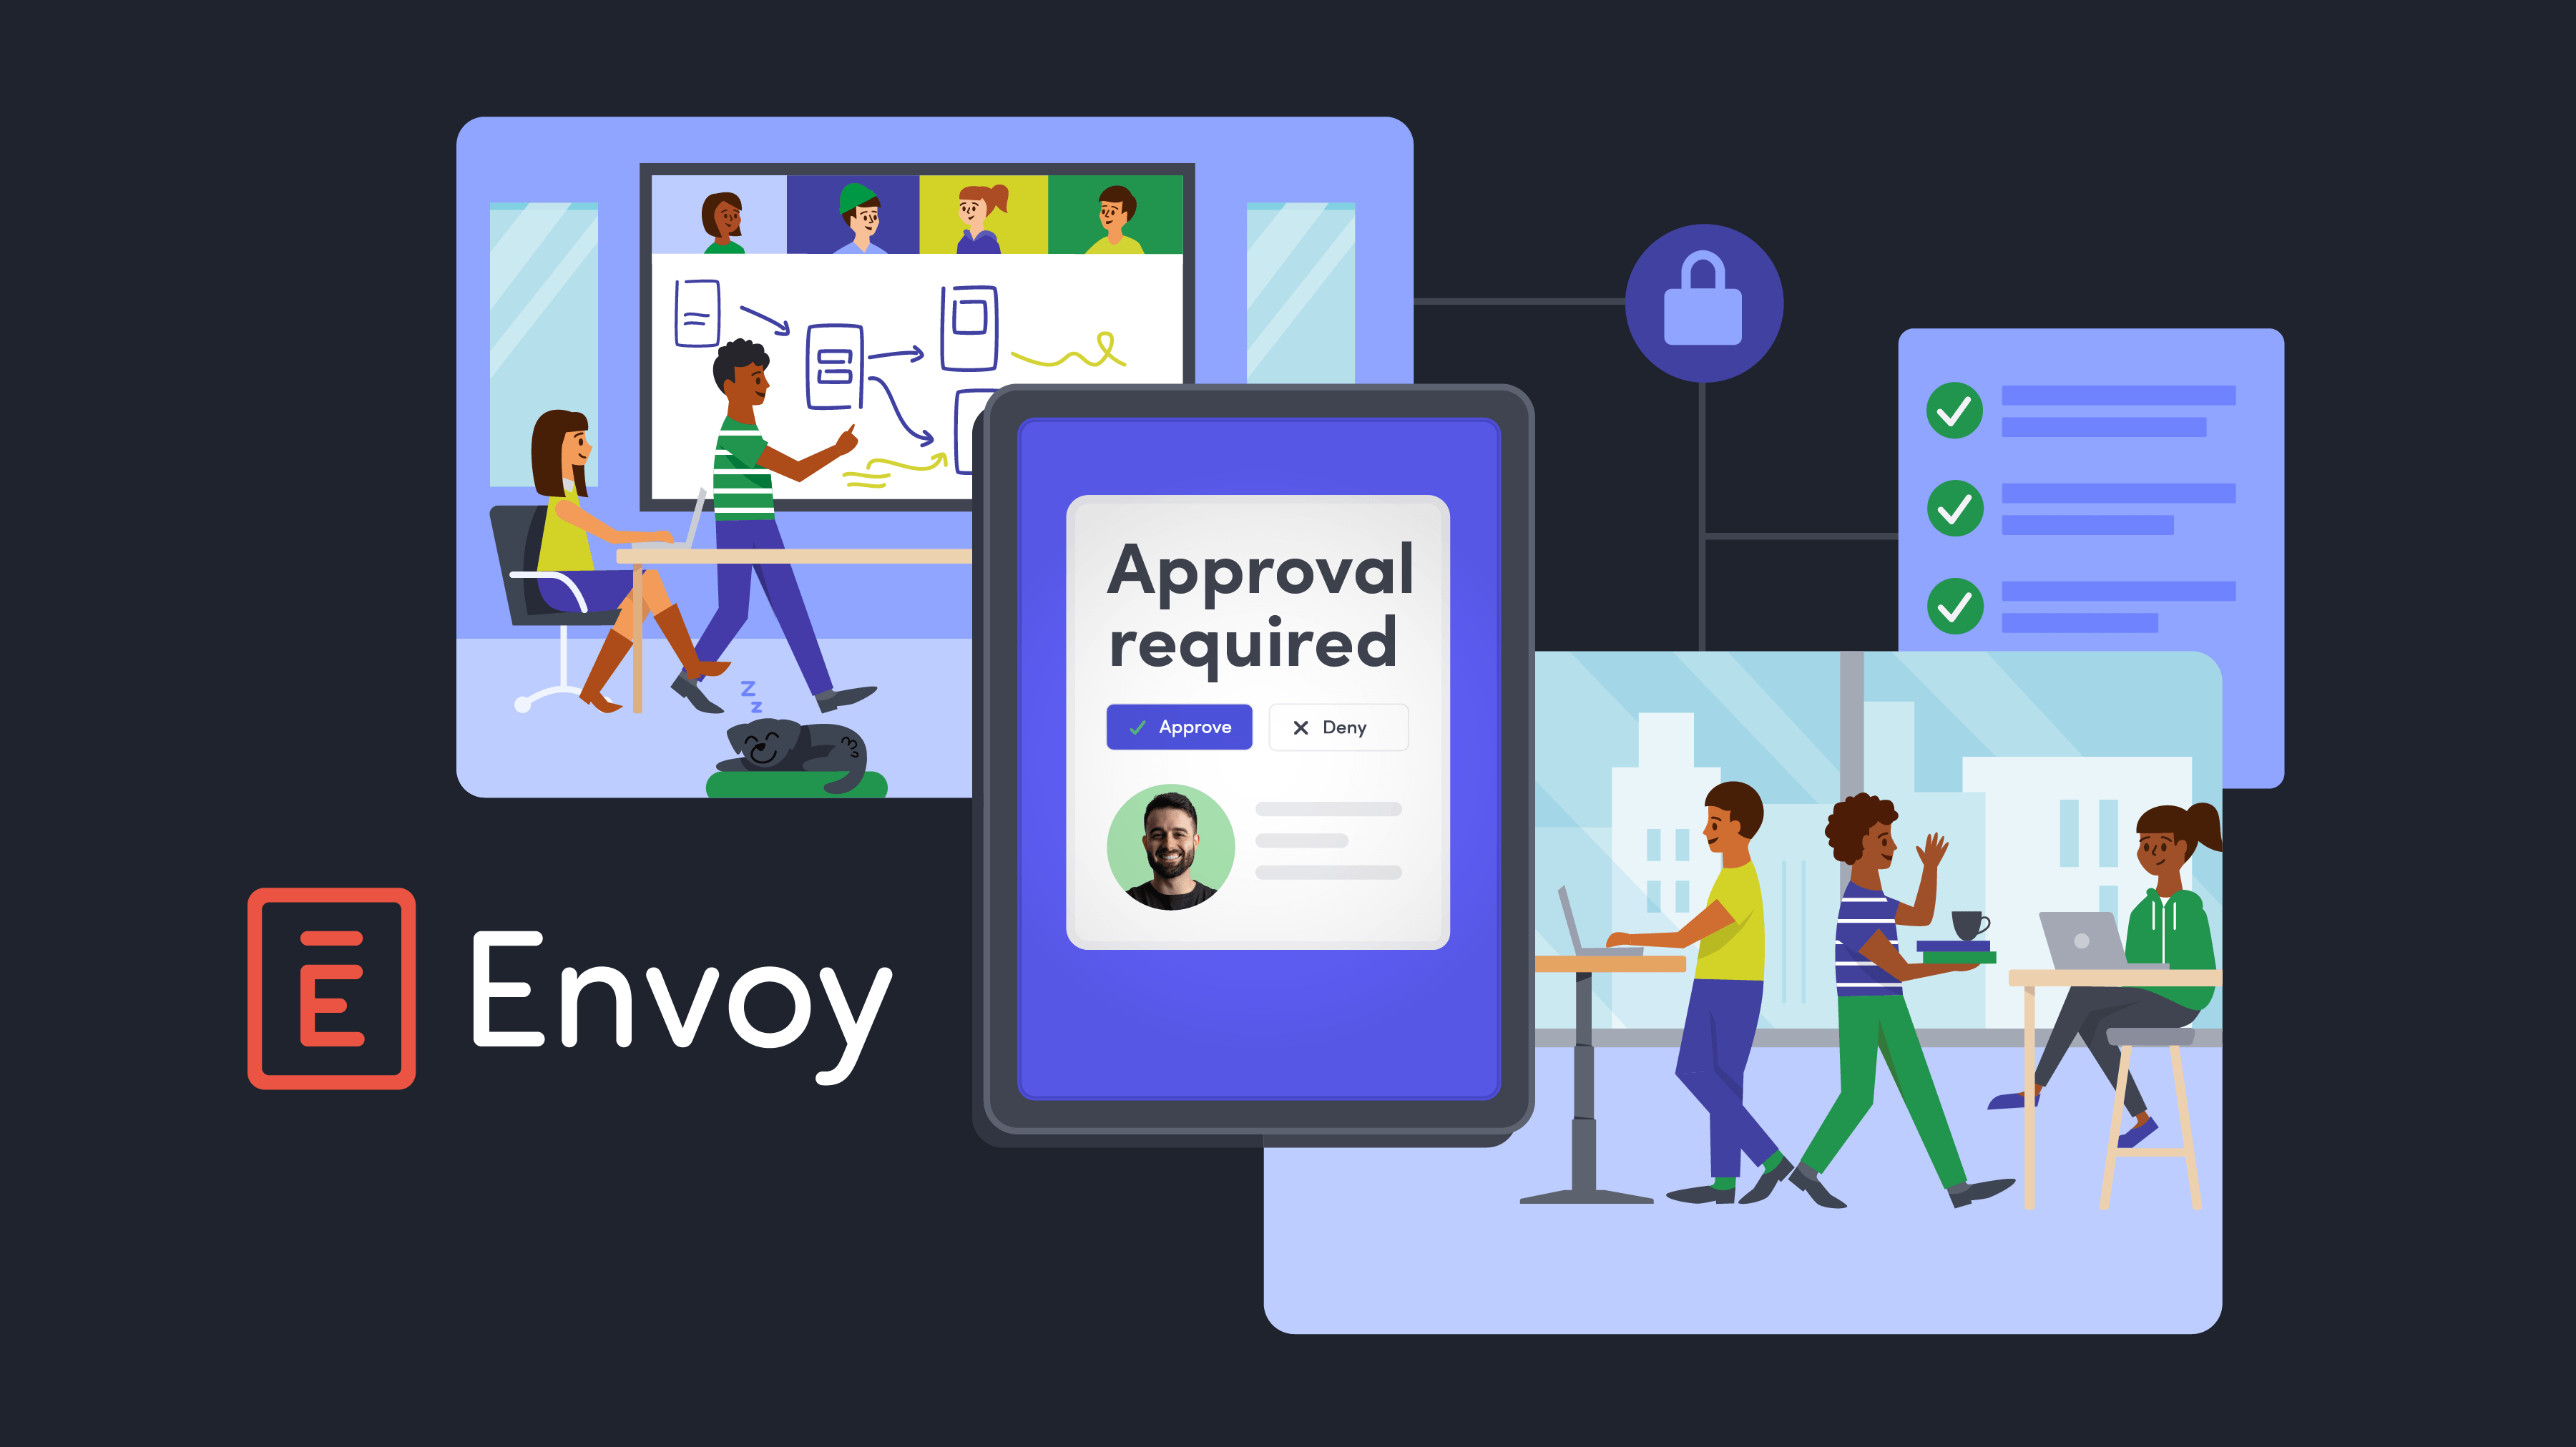
How Envoy Reduced Observability Data Volume by 90% Without Touching a Single Dashboard
Grepr Just Launched a Free Tier: Reduce telemetry noise by 90%

Grepr Wins the 2026 Intellyx Digital Innovator Award for Observability Cost Reduction
Get started free and see Grepr in action in 30 minutes.
