
.gif)
These two data types share the same dashboards and the same postmortem conversations, which is probably why they get conflated. They're generated differently, structured differently, and when your observability bill gets out of hand, they fail you differently.
What Are Application Logs?
Every logger.info(), console.log(), or log.printf () in your codebase is for application logging. A developer wrote that line. Nothing gets logged that someone didn't explicitly put there.
That's the point, and the problem. A service can log every successful request in exhaustive detail and silently swallow every exception. There's no agent filling in what the developer didn't write.
Structured logging is standard practice now, but the schema is only as consistent as the team. Two services can use different field names for the same concept, which surfaces as a real headache when you're trying to correlate them mid-incident across a distributed system.
On the other hand, developers can surface anything they need for troubleshooting or analysis later, whether it's the size of an internal cache, the number of threads spawned as a result of a particular request, or the state of a state machine during execution. These are semantics for which today there is still no other way to surface.
What Are APM Traces?
APM instrumentation hooks into your HTTP frameworks, database drivers, and messaging layers automatically. No log statements required.
The output is traces and spans. A trace is the full record of a request as it moves through your system. Spans are the steps inside it: the incoming HTTP call, the database query it triggers, the cache lookup, or the downstream service call. Each span carries timing, service name, operation name, status, and the IDs linking it to its parent and root trace.
Because instrumentation defines the schema rather than individual developers, spans across different services and languages follow the same structure. A trace ID injected into a request in your Go gateway is the same trace ID in the span your Python worker emits several hops later. That's what makes distributed tracing work across a heterogeneous stack.
Where They Overlap
When application logs are configured to inject the active trace ID into each log line, you can navigate from a trace directly to the log output from that exact request across every service it passed through. You get a performance profile from the trace and code level context from the logs, , in the same session.
Both types capture errors from different vantage points. A logger.error() records the exception your code caught. An APM agent records what your code didn't: unhandled exceptions, 5xx responses, queries that crossed a latency threshold. Neither alone tells the whole story during an actual incident.
Why This Distinction Shows Up in Your Observability Bill
APM instrumentation generates a span for every operation in every instrumented request. A single API call touching a database, cache, and downstream service produces multiple spans. Most of them represent successful operations that look essentially identical to each other, and you're paying to index all of them.
Application logs have a different volume profile but the same problem shape. A verbose service generates a lot of log lines per request. In microservices, a single user-facing action triggers logging across multiple services simultaneously, plus background jobs, health checks, and scheduled tasks.
The data dominating storage in both cases is data from everything going fine, repeated at high volume with no new signal.
When to Reach for Each
For anything related to business logic that is not understandable from method names or API endpoints, logs are where you look. A fraud rule that fired, a retry that eventually succeeded, a feature flag that changed the execution path: none of that appears in a trace.
For performance, cross-service request flow, and error rates at scale, traces are the tool. The instrumentation is automatic and consistent. You're not hoping a developer logged the right detail in the right place.
The Volume Problem Both Share
Large volumes of repetitive data, indexed at full cost in case anyone ever needs them. That's the actual driver behind most observability bills, regardless of which data type is doing the damage.
Grepr's semantic ML engine identifies repetitive patterns in log streams and aggregates them. Its signature sampling applies the same logic to trace data. Errors, anomalies, and novel patterns pass through to your existing tools at full fidelity. All raw data is retained in S3 in open formats for retroactive investigation.
FAQ
What is the difference between a trace and a log?
A log exists because a developer wrote a statement to create it. A trace exists because an instrumentation agent recorded what happened automatically, whether or not anyone wrote a log statement. In practice you often want both when debugging: the trace shows you where in the request path something went wrong and how long each step took, and the logs show you what the code was actually doing and deciding at that moment.
Do I need APM traces if I already have detailed application logs?
The gap logs can't fill is cross-service request stitching. You can see that each service logged activity during a time window, but connecting those entries into a coherent picture of one user's request requires trace IDs propagated through every hop. Without that you're doing timestamp matching across services and making educated guesses. Traces handle that stitching automatically.
Can application logs replace APM?
You can get partway there by manually propagating request IDs and logging timing data at every operation. Teams did this before APM tooling matured and it works up to a point. The overhead is real though: you're writing and maintaining instrumentation code that an agent would handle automatically, and you still won't get service maps or fleet-wide latency analysis without building aggregation on top of it yourself.
Why do APM traces generate so much data?
Every instrumented operation produces a span. A request through a moderately complex service, one that hits a database, checks a cache, and calls a downstream API, generates multiple spans before it returns. That multiplies by request volume, and most of those spans represent successful operations that look essentially identical to each other.
What is log-trace correlation and how do I set it up?
Log-trace correlation links your application log lines to the active trace at the time they were written, using shared trace and span IDs. In practice, you configure your logging library to pull the current trace context from your OTel SDK or APM agent and inject it into each log record. Most APM SDKs and OTel logging bridges support this with minimal configuration. Once it's in place you can jump from a latency spike in a trace directly to the log output from that specific request across every service it touched.
More blog posts
All blog posts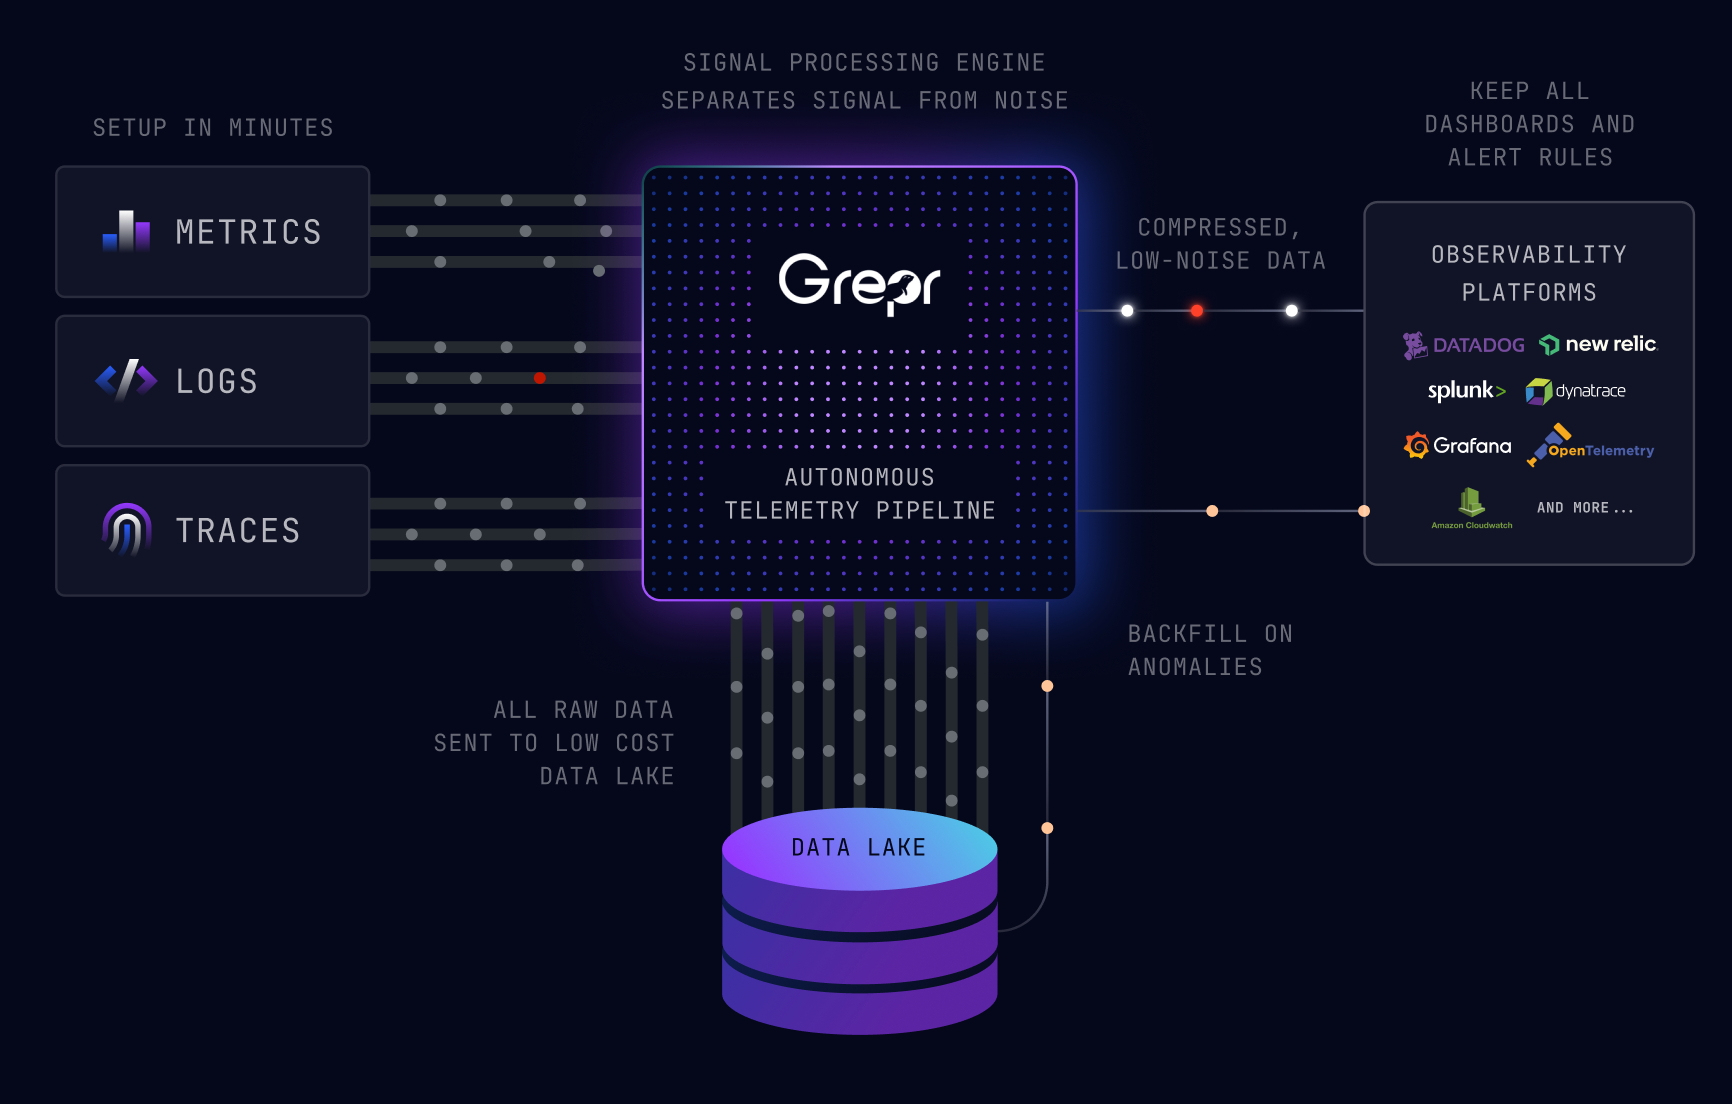
Grepr Just Launched a Free Tier: Reduce telemetry noise by 90%

Grepr Wins the 2026 Intellyx Digital Innovator Award for Observability Cost Reduction

What We Heard at Observability Summit 2026
Get started free and see Grepr in action in 30 minutes.
